When is the Stock Bounce Coming?

Please enjoy this updated version of weekly commentary from the Reitmeister Total Return newsletter. Steve Reitmeister is the CEO of StockNews.com and Editor of the Reitmeister Total Return.Click Here to learn more about Reitmeister Total Return


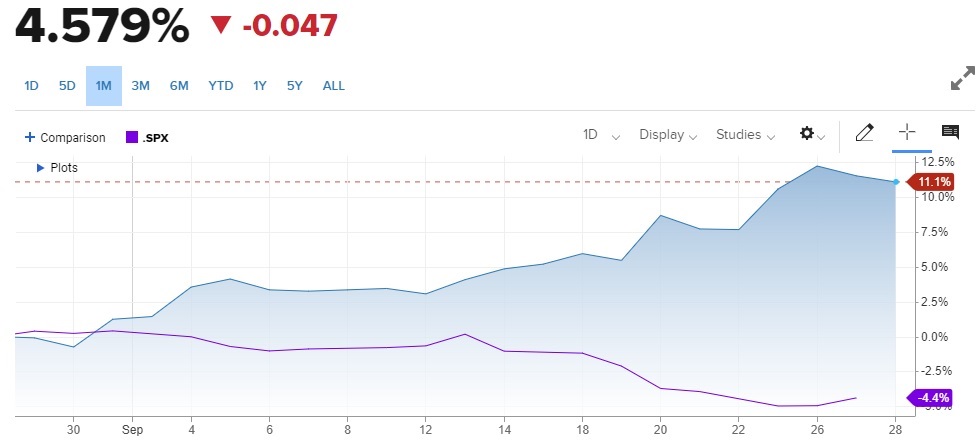
SPY – Higher bond rates have been the main catalyst behind lower stock prices. Yet with the S&P 500 (SPY) pressing down towards the 200 day moving average we are all wondering when stocks will finally bounce. Steve Reitmeister reviews the facts in hand to help investors navigate the choppy investment waters. Read on below for the full story…

In last week’s commentary I focused on the following relationship:

Rates Up > Stocks Down

Now everyone is quite aware of this dynamic explaining the continued pressure on stock prices with the S&P 500 (SPY) at the lowest level in months.

However, what remains unclear to most is… WHY it this happening…and how much higher could rates go?

That will be the focus of this week’s Reitmeister Total Return commentary.

Market Commentary

The reason for higher long term bond rates is quite simple…and actually has nothing to do with current inflation issues which are likely to fully moderate in the coming 12-24 months. What this boils down to is the following term that you will see more and more:

Rate Normalization

Meaning that rates have been “abnormal” ever since the Great Recession as the Fed used every tool imaginable to crush interest rates to reinvigorate the economy. The ante got upped during Covid with rates tumbling down to a historic low of 0.5% for the 10 year Treasury.

Let’s review this 60 year chart to appreciate the trends over the years:

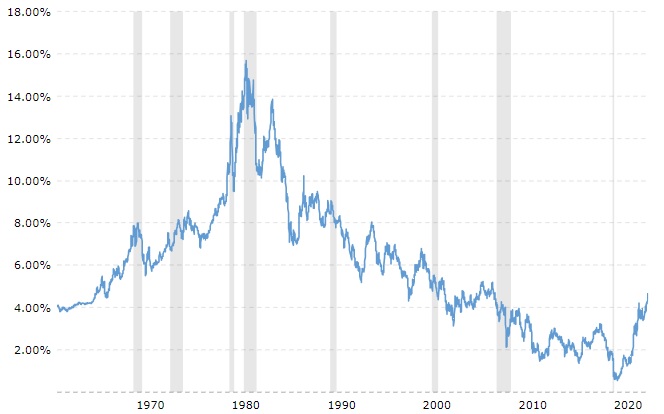
There really have been 2 abnormal periods in history. We just spoke about rates tumbling to all time lows after the Great Recession through Covid (2008-2020).

Now check out the spike in rates during the hyper-inflation period of the late 1970’s. This peaked in 1982 thanks to the hard work of then Fed Chair Volker.

So what are normal rates for the 10 year Treasury?

There is some debate, but most say 4.5% to 5%.

Where are we today? Smack dab in the middle at 4.79%.

Yes, that is much higher than recent memory…but not really high in the grand scheme of history. And thus not necessarily a reason for the economy to come to a screeching halt and thus not a reason to flee stocks in the long run.

Yet in the short run, some adjustments to investment portfolios have to be made. For example, with yields this high we all can get a decent rate of return with bonds and money market accounts without taking any real risk. This is having more money flowing out of stocks towards bonds.

That is not a brand new phenomena as bond fund flows have been very positive since late 2022. The greater question now is when will we hit peak rates…and thus when will the stock market carnage end?

If you line up 10 investment experts, they will give you 10 different opinions. Because to be honest, 90% of them didn’t really see this coming. And thus cant give a straight answer on how/when it ends.

That is why I thought valuable to draw back to the picture of the historical rates. When you remove the abnormal highs and lows you find that we are pretty close to normal. So, it is fair to imagine that 5% could present a reasonable near term top for rates.

Unfortunately…who says that the market is rational?

The bond market gets hit with waves of fear and greed just like the stock market. And thus we could easily go well past 5% bond rates before things correct back to normal levels. And yes, that would be bad for stock prices.

Truly we are at a critical juncture. Not just about the direction of bond rates, but also stocks are on closing in on the most important technical level. More on that in the next section.

Price Action & Trading Plan

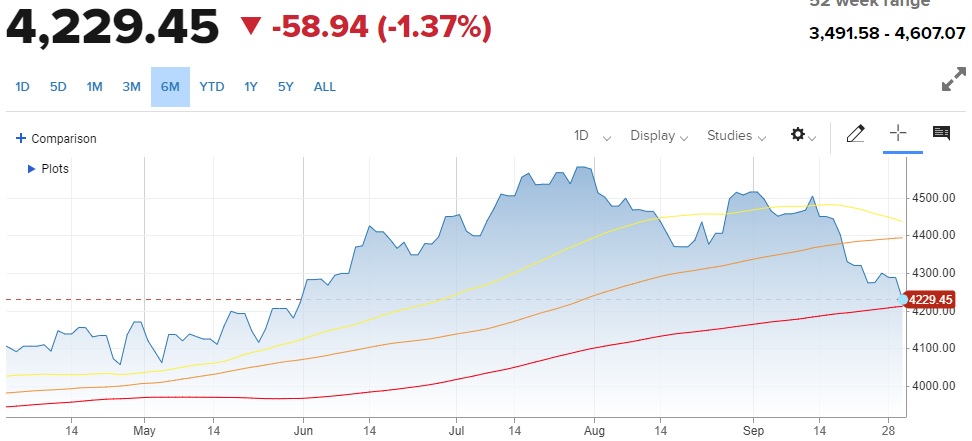
Moving Averages: 50 Day (yellow), 100 Day (orange), 200 Day (red)

There is no way to paint this picture in a positive light. As you can see, this past month stocks have broken down past support at the 50 day and 100 day moving averages. So obviously now we are all wondering how well the 200 day moving average will hold up at 4,202.

Personally, I like the odds of seeing solid short term support at this level. BUT if the 10 year Treasury rates start raging above 5%…then I suspect stocks will spend some time below the long term trend line only adding to recent negativity.

As for our trading strategy, we are 100% invested and have taken advantage of the recent dip to add stocks & ETFs that should excel when a bounce finally ensues. But a serious break below the 200 day moving average would have me consider more conservative measures. Like perhaps retreating to 70-80% long.

Why not more conservative or even bearish?

Would need to see more serious reason to believe in a recession forming that would provide a fundamental reason for extended stock downside. OR a deeper break under the 200 day that would have to be heeded in our strategy.

Either one of these would have use getting less long stocks…and potentially buying inverse ETFs to profit from downside.

Hard to explain why…but I have little fear of that at this moment. And just sense a bounce should soon be in hand with the picks in our portfolio leading the parade higher.

What To Do Next?

Discover my brand new “2024 Stock Market Outlook” covering:

  • Bear Case vs. Bull Case
  • Trading Plan to Outperform
  • What Industries Are Hot…Which Are Not?
  • Top 11 Picks for the Year Ahead
  • And Much More!

Gain access to this vital presentation now by clicking below:

2024 Stock Market Outlook >

Wishing you a world of investment success!

About the Author

Steve is better known to the StockNews audience as “Reity”. Not only is he the CEO of the firm, but he also shares his 40 years of investment experience in the Reitmeister Total Return portfolio. Learn more about Reity’s background, along with links to his most recent articles and stock picks.

Light at the End of the Tunnel for Anheuser-Busch (BUD) Stock?

Anheuser-Busch InBev SA/NV (BUD), a leading multinational brewing company once hailed as one of the largest firms within its sector, is widely recognized for housing popular brands such as Stella Artois, Beck's, and Budweiser in its extensive portfolio.

The corporation has a notable history of collaborating with celebrities and social media influencers to enhance its beer promotions. However, its recent partnership with the prominent transgender influencer Dylan Mulvaney sparked both condemnation and commendation from various factions, thus generating significant media attention.

This alliance became embroiled in a heated controversy tied to a Bud Light campaign focused on the transgender community. Consequently, amid the media fuss, the brewing giant's stock declined about 20% in May. Fanning the flames of their troubles, BUD’s layoff of more than 300 U.S. employees accentuated the growing challenges faced by the company.

The Controversy and Its Impact

BUD partnered with Mulvaney to amplify its “Easy Carry Contest,” offering customers a chance to win a grand prize of $15,000 for sharing videos of themselves carrying as many cans of BUD's beer as possible. To promote the contest, Mulvaney posted a sponsored video on TikTok in April 2023, featuring a Bud Light can adorned with her face, gifted by the company upon the first anniversary of her public declaration as transgender.

However, this instigated severe criticism from conservative anti-trans groups, who perceived this move as Bud Light pushing a certain "agenda." Consequently, calls for a boycott against the beer brand erupted.

Bud Light’s share of the U.S. beer revenue had plummeted to 8.9% by the week ending on September 9. Likewise, Bud Light sales witnessed a staggering decline of roughly 30% in both volume and dollar worth in the month leading up to September 9, compared to the prior-year period.

Moreover, BUD witnessed a plunge in U.S. revenue in the second quarter, primarily driven by the social media-led boycott. The brewer’s second-quarter revenue in the U.S. saw an alarming 10.5% decline, while operating profits experienced a nearly 30% decrease.

The boycott's impact stretched far beyond the immediate sphere, impacting BUD's primary operations and creating ripple effects across its associated enterprises such as breweries, distributors, and labor force. An unfortunate repercussion was the reported bombing threats targeted at select breweries, accompanied by incidents of employee harassment.

The backlash grew so extensively that it prompted HSBC to downgrade BUD's stock. In June, Mexican lager Modelo Especial dethroned Bud Light, claiming the title of America's favorite beer, a position Bud Light had defended for over two decades.

Nevertheless, enduring these challenges, BUD enjoyed a surge in global profits due to price increases and strengthening sales in markets outside the U.S. Its operational presence spread across various international markets facilitates business diversification and alleviates the effects of adverse publicity.
Its leading portfolio contributed to a mid-single-digit revenue rise, somewhat counter-balancing the declining Bud Light sales in the U.S. This was propelled by a double-digit growth occurrence in South Africa and Colombia.

Several analysts suggested that the stock’s depreciation may be an overreaction, proposing that the company could recover even amid the backlash. In alignment with this view, Bank of America upgraded its rating on BUD, positing that the brewing titan boasts a diversified brand portfolio, widespread geographic presence, and potential for margin expansion.

In the prevailing environment, Bank of America labeled the brewer a "relatively defensive stock," projecting positive earnings growth for the company in 2023. Following the upgrade to a 'Buy' from a 'Neutral' standing, BUD's stock prices ascended approximately 4%.

With BUD recording impressive revenue figures exceeding $57 billion last year, it is challenging to predict how much boycotts alone can substantially disrupt its financial stability. The following key factors could notably sway the future trajectory of the brewing behemoth:

Mixed Financials

During the fiscal second quarter that ended June 30, 2023, BUD’s revenue rose 2.2% year-over-year to $15.12 billion. Its gross profit grew 1.3% from the prior-year quarter to $8.10 billion.

However, the company’s normalized EBITDA declined 3.7% from the year-ago quarter to $4.91 billion. Also, underlying profit attributable to equity holders of BUD and earnings per share fell 1.1% and 1.4% year-over-year to $1.45 billion and $0.72, respectively.

Mixed Valuation

BUD’s forward EV/Sales and Price/Sales of 3.12x and 1.74x are 84.9% and 62% higher than the industry average of 1.69x and 1.07x, respectively. However, its forward non-GAAP PEG multiple of 1.56 is 27.7% lower than the industry average of 2.15. Also, its EV/EBITDA multiple of 9.31 is 18.7% lower than the industry average of 11.45.

Robust Profitability

BUD’s trailing-12-month gross profit and levered FCF margins of 54.21% and 11.84% are 64.5% and 247.4% higher than the industry averages of 32.96% and 3.41%, respectively. Its trailing-12-month cash from operations of $12.71 billion is significantly higher than the industry average of $457.15 million.

Growing Interest of Smart Money

A notable activity around BUD's shares has been observed, indicating a climate brimming with significant trading interest. The ongoing boycotts seem to have fallen short of nullifying the belief in the beer giant’s potential recovery.

Confirming this outlook, the Bill & Melinda Gates Foundation Trust, under the stewardship of business titan Bill Gates, secured 1,703,000 shares of BUD. This acquisition is estimated at about $95 million and asserts renewed faith in the brand’s value.

Notably, several institutions have recently modified their BUD stock holdings. Of the 567 institutional holders, 211 have increased their positions in the stock. Moreover, 70 institutions have taken new positions (4,737,413 shares).

Price Performance

BUD’s shares have plunged more than 20% over the past six months but gained more than 15% over the past year. The stock also trades below its 50-day and 100-day moving averages of $56.47 and $56.80, respectively, indicating a downtrend.

However, Wall Street analysts expect the stock to reach $67.56 in the next 12 months, indicating a potential upside of 27.5%. The price target ranges from a low of $57.59 to a high of $76.

Mixed Analyst Estimates

For the fiscal third quarter ending September 2023, BUD’s revenue and EPS are expected to come at $15.98 billion and $0.85, up 5.9% and 4.5% year-over-year, respectively.

For the fiscal year ending December 2023, BUD’s revenue is expected to increase 6% year-over-year to $61.28 billion, whereas its EPS is expected to decline 3.8% year-over-year to $3.03.

Bottom Line

In an unusual turn of events, the latest controversy involving social media influencers associated with BUD has reportedly sent ripples through its stock prices. The handling of this incident by the beverage company and the resulting negative media coverage has left investors perturbed about potential harm to its corporate image. The boycotts engulfing BUD brands only raise concerns about a possible negative hit on revenue.

Another industry development provoking potential unease for BUD's future market position is the impending entry of Tilray Brands into the beer market, which could further challenge BUD's financial foothold.

The collateral damage from the backlash notably seems concentrated within developed markets like the U.S. However, analysts indicate that the sell-off wave may have peaked, adding that the overall disturbance could have limited repercussions outside U.S. borders. Many specialists see the decline in BUD's stock valuation as an attractive entry point for prospective investors.

Signs of continuing faith in the beleaguered beer company's resilience are reflected in Bank of America’s upgrade during the turmoil and noteworthy investments made by institutions. Such actions underline hint at BUD's perceived capability to recover and enhance its market value over time.
However, considering it tepid price momentum, mixed financial indicators, and analyst estimates, it might be in investors' best interest to wait for a more opportune entry point in the stock.

Airbnb (ABNB): Is the Final Bell Tolling for the Home-Sharing Giant?

Airbnb, Inc. (ABNB), with a market cap of $87.14 billion, is a prominent online hospitality platform that facilitates home and room rentals for travelers. However, 2023 proved to be a challenging year for the enterprise, as it faced stumbling blocks from social media backlash to fierce competition and regulatory obstruction.

The year started with the so-called "Airbnbust" chaos in March, wherein disgruntled hosts aired grievances on X (formerly Twitter) concerning diminishing returns and fears of a short-term rental market bubble.

Adding salt to the wound, rival company Vrbo preceded ABNB in introducing a much-sought-after loyalty program feature, thereby gaining a competitive edge.

Furthermore, the home-sharing giant faced regulatory hurdles in September when New York City severely tightened its regulations on short-term rentals, reducing ABNB’s occupancy in a market that historically constituted about 80% of its operations.

The Recent Bans on Airbnb

New York City has enacted a new law mandating short-term rental hosts to register with the city. This limits rentals to properties where the host resides and is present during the guest's tenure, further restricting the number of guests to a maximum of two per listing. ABNB has called this a “de facto ban” on its business, prompting a lawsuit against the city; however, the judiciary dismissed this claim.

This restriction is not exclusive to New York City. Other global cities also impose restrictions on ABNB, citing concerns over the platform’s effect on the housing market, residents' quality of life, and the safety of guests and hosts.

For instance, in Dallas, where short-term rentals are restricted to designated neighborhoods, a 10 p.m. curfew is implemented to forestall troubling and potentially hazardous parties, and the city further necessitates hosts to procure a permit and pay a fee for each listing.

San Francisco has set a cap on the days a host can rent out their entire residence through short-term leasing - a maximum of 90 days per year. Hosts must register with the city and remit a tax on the income generated from these short-term rentals.

In Amsterdam, restrictions include a cap on the number of nights for rental at 30 nights a year. Additional restrictions prevent short-term rentals in certain precincts, with fines imposed for violations.

Paris provides another case, setting a limit on annual rental days at 120 days and requiring hosts to register with the city and prominently display their registration number on their listings. Paris has embarked on a rigorous crackdown on illegal short-term rentals, deploying inspectors to conduct apartment raids, resulting in substantial penalties for non-compliance.

The Repercussions of the Bans

The restrictions imposed in New York City and other regions could potentially deal a significant blow to the home-sharing company, affecting the core elements of its business structure, including revenue, growth, reputation, and stakeholder relations.

The ban is anticipated to decrease the number of listings, bookings, and users ABNB can accommodate in the impacted areas, particularly New York City, one of the company's biggest and most lucrative markets. This could reduce the company's revenue stream and market share, diminishing its valuation and hindering growth opportunities.

Trust and loyalty from hosts and guests alike may take a hit as members of the ABNB community face disappointment due to restrictions or ensuing legal disputes. Hosts may lose income or be penalized for rule infringements, while some guests may experience scarcity in desirable or reasonably priced accommodation options. This could negatively affect ABNB by reducing consumer satisfaction and tarnishing its brand image and reputation.

Moreover, the ban amplifies ABNB’s regulatory and legal risks and costs. It could face additional challenges or lawsuits from authorized bodies or industry competitors in various jurisdictions. The need to lobby for policy alterations, negotiations with regulators, or adaptations to its business model and operations to adhere to existing or future regulations could significantly magnify ABNB's expenditure of resources and efforts.

Such changes could adversely impact the company's profitability, sustainability, innovation capacity, and competitiveness. Shareholders may lose confidence in the company’s ability to thrive in the face of regulatory challenges and legal disputes.

However, every cloud carries a silver lining. The ban could provide ABNB an avenue to diversify its offerings and markets. It may find this an opportune moment to increase its presence in less-regulated sectors or regions more accommodating to its platform. By leveraging its strong brand image, faithful customer base, diverse portfolio, and resilient business model, the company could successfully adapt to evolving travel trends and legislative measures.

This adaptability could assist ABNB in preserving or augmenting its unique value proposition and points of differentiation. It could potentially bolster growth and solidify its preeminence within the industry.

Despite the complexity of the situation, it is vital to point out a few other potential areas of optimism. Here are some additional impactful factors that could steer ABNB’s course in the upcoming months:

Robust Financials

ABNB’s revenue for the fiscal second quarter that ended June 30, 2023, increased 18.1% year-over-year to $2.48 billion. Its income from operations rose 41.7% year-over-year to $523 million.

Additionally, the company’s net income and net income per share increased 71.5% and 75% year-over-year to $650 million and $0.98, respectively. Also, its adjusted EBITDA increased 15.2% year-over-year to $819 million.

Stretched Valuation

ABNB’s forward EV/Sales and Price/Sales of 8.08x and 8.90x are 608.2% and 945.1% higher than the industry averages of 1.14x and 0.85x, respectively. Moreover, its forward non-GAAP P/E multiple of 34.54 is 142.9% higher than the industry average of 14.22.

Growing Institutional Ownership

ABNB’s robust financial health and fundamental solidity make it an appealing investment opportunity for institutional investors. Notably, several institutions have recently modified their ABNB stock holdings.

Institutions hold roughly 67.5% of ABNB shares. Of the 1,139 institutional holders, 517 have increased their positions in the stock. Moreover, 111 institutions have taken new positions (3,766,197 shares).

Insider Trading Activities

There are growing apprehensions due to an increasing trend of insider selling during the past year. On September 27, Nathan Blecharczyk, the company’s Chief Strategy Officer, disposed of 40,000 shares without executing any purchases over the past year.

On September 25, 2023, Aristotle Balogh, ABNB’s CTO, sold 2,750 shares of the company. Over the past year, Balogh has sold a total of 149,750 shares and has not purchased any shares.

Furthermore, on September 12, 2023, Brian Chesky, CEO and Chairman, sold 150,000 company shares. This is part of a series of such transactions over the course of the past year, where Chesky sold a total of 270,000 shares.

Optimistic Analyst Estimates

Analysts expect ABNB’s revenue and EPS for the quarter ending September 2023 to increase 17% and 16.6% year-over-year to $3.36 billion and $2.09, respectively. It surpassed the consensus revenue and EPS estimates in each of the trailing four quarters.

Price Performance

Shares of ABNB have gained 30% over the past year and 2.8% over the past month to close its last trading session at $136.56. The stock is presently trading below its 50-day moving average of $138.06 but above its 100-day moving average of $130.26.

Wall Street analysts expect the stock to reach $150.16 in the next 12 months, indicating a potential upside of 10%. The price target ranges from a low of $105 to a high of $185.

Bottom Line

A permanent or irreversible ban could significantly impact ABNB, necessitating the closure or termination of its primary operations within the affected regions. This could entail considerable losses for shareholders or require significant write-offs on their investments, potentially prompting them to sell shares at a reduced rate or disengage from the company entirely.

Furthermore, it is crucial to highlight that though insider selling can provide hints to investors, it does not definitively denote a pessimistic future for the company.

However, considering the encompassing circumstances and ABNB's inflated valuation, it could be wise to wait for a better entry point in the stock.

2024 Stock Market Outlook

Please enjoy this updated version of weekly commentary from the Reitmeister Total Return newsletter. Steve Reitmeister is the CEO of StockNews.com and Editor of the Reitmeister Total Return.Click Here to learn more about Reitmeister Total Return


SPY – The time to think about the 2024 stock market is now. Will it be a bull or bear? Where does the S&P 500 (SPY) end the year? And what are the top picks to outperform? Investment veteran Steve Reitmeister does his level best to answer all these questions. Just read on below…


Tell me if you see the pattern…

2019 Bull Market

2020 Bear Market

2021 Bull Market

2022 Bear Market

2023 Bull Market

Given the above, the logical question on everyone’s mind should be…Will the bear market come back again in 2024?

This led to me record a brand new presentation this week that covers vital topics including:

  • Bear Case
  • Bull Case
  • And the Winner Is???
  • Trading Plan to Outperform
  • Top 10 Picks Right now
  • Pick #11 Coming Monday Morning
  • And Much More!

Gain access to this vital presentation now by clicking below:

2024 Stock Market Outlook >


Let me pull back the curtain on this presentation just a little more so you can appreciate why now is the perfect time to watch this presentation…

The goal was to give you a running head start to outperform in the year ahead.

If it sounds early to do that now please realize that most of the market is run by institutions. And they plan out several months in advance.

So if you are not thinking of 2024 right now…you are behind the curve.  

First off, we need to settle the bull vs. bear debate.

Will it follow the on/off pattern of the last few years?

Or will new market dynamics create a shift in the outcome?

And where does the S&P 500 (SPY) end up by years end?

The Fed is most certainly a big part of that market outlook equation. And to be honest, it has become a more complicated riddle of late…but solving that puzzle is truly the key to outperformance in the year ahead.

Next up we need to review which stock groups are likely to lead the way:

  • Large Caps vs. Small Caps?
  • Growth or Value Stocks?
  • Tech Still in Charge…Or Time for Others to Shine?

Considering the above led me to my current portfolio of 11 hand selected trades (4 ETFs and 7 stocks focused on the groups most likely to outperform).

All this and more awaits you in my new presentation. So please click below to start watching now:

2024 Stock Market Outlook >

Wishing you a world of investment success!

Steve Reitmeister
…but everyone calls me Reity (pronounced “Righty”)
CEO StockNews.com & Editor of Reitmeister Total Return


About the Author

Steve is better known to the StockNews audience as “Reity”. Not only is he the CEO of the firm, but he also shares his 40 years of investment experience in the Reitmeister Total Return portfolio. Learn more about Reity’s background, along with links to his most recent articles and stock picks.

Stock Market vs. Bond Rate Relationship Revealed

Please enjoy this updated version of weekly commentary from the Reitmeister Total Return newsletter. Steve Reitmeister is the CEO of StockNews.com and Editor of the Reitmeister Total Return.Click Here to learn more about Reitmeister Total Return


SPY – The stock market is affected by many things like the Fed and the economy. However, there is not enough talk about how the movement of bond rates makes stocks more or less attractive. Like how the S&P 500 (SPY) is having a terrible September as bond rates explode higher. Learn more about this dynamic relationship and what it means for stock prices in the days ahead.

Investors have long appreciated the relationship that when rates go up…stocks go down.

That was a prime catalyst behind the 2022 bear market. Yet investors were encouraged in 2023 that inflation was coming under control…and thus rates would head lower in the future. This had stocks back on the rise for the majority of the year.

Then on 9/20 the Fed said “NOT SO FAST!” which had rates spiking again…and investors fleeing stocks.

Did that story take a turn for the better on Thursday?

Let’s review in this week’s commentary.

Market Commentary

The best place to start our conversation is with this 1 month chart showing the rise of the 10 Year Treasury rate vs. the decline of the S&P 500 (SPY):

The inverse relationship is quite apparent. As rates accelerated higher later in the month…the stock decline accelerated as well.

The reasons behind the higher rates was explained in detail in my commentary after the 9/20 Fed announcement. Here is the core section for our discussion today:

“…Nutshell of the Wednesday Fed announcement.

The economy is doing better than we expected…so it’s going to take a bit longer to bring down inflation to target level…the good news is that we really believe we can do it without creating a recession.

So why did stocks go down on this seemingly positive outlook?

Because the dot plot of rate expectations by Fed officials now has the end of 2024 rate still way up at 5.1%. That was revised higher from the previous estimate of 4.6%.

Yes, this most certainly fits in with the Fed narrative of “higher rates for longer”, but much longer and higher than investors previously anticipated.”

Now let’s narrow in on what happened with 10 year Treasury rates on Thursday:

This one day chart shows how rates continued to spike early in the session Thursday up towards a high of 4.688%. Yet dramatically reversed course ending the session down at 4.577%. That also helped stocks enjoy one of their best sessions in a while. (The bond sell off extended into Friday which increases the odds we have seen peak rates).

Please remember that rates were down around 3.8% just a couple months ago. This is a dramatic move that may have finally run its course. If so, then it helps improve the odds that we have made a bottom with stocks moving higher from here.

The biggest surprise I see with the recent rise in bond rates is how the likelihood of a rate hike at the November 1st Fed meeting has dropped from 62% just a month ago to only 19% as of today. Further the idea of a raise happening by the December 13th meeting has declined to 36%.

This information just doesn’t jive with Fed statements in September which seemed to indicate strong likelihood of at least one more hike. Nor does it jive with soaring bond rates. Again, perhaps another clue that the rally in bond rates is overextended and ready to retreat which is good for stocks.

Pulling back to the big picture it is very hard to have a bear market without a recession forming. And right now the odds of that are fairly low.

That is why I believe that this sell off is finding a bottom around current levels. And perhaps no further than the 200 day moving average closing in on 4,200. That is the downside possibility.

Whereas the upside potential this year has us retesting the highs of 4,600 seen in late July. And then next year likely cracking above 5,000.

Thus, I recommend staying fully invested in this market. The key to success is picking the best investments. And that is what we will cover in the next section…

What To Do Next?

Discover my brand new “2024 Stock Market Outlook” covering:

  • Bear Case vs. Bull Case
  • Trading Plan to Outperform
  • Top 11 Picks for the Year Ahead
  • And Much More!

Gain access to this vital presentation now by clicking below:

2024 Stock Market Outlook >

Wishing you a world of investment success!


Steve Reitmeister…but everyone calls me Reity (pronounced “Righty”)
CEO, StockNews.com and Editor, Reitmeister Total Return


About the Author

Steve is better known to the StockNews audience as “Reity”. Not only is he the CEO of the firm, but he also shares his 40 years of investment experience in the Reitmeister Total Return portfolio. Learn more about Reity’s background, along with links to his most recent articles and stock picks.