Are Stock Investors Losing that Loving Feeling?

Please enjoy this updated version of weekly commentary from the Reitmeister Total Return newsletter. Steve Reitmeister is the CEO of StockNews.com and Editor of the Reitmeister Total Return.Click Here to learn more about Reitmeister Total Return


SPY – The big early 2023 bull rally for the S&P 500 (SPY) is now officially over. What comes next? How best to trade this more difficult environment? And what are the best picks for the months ahead? Steve Reitmeister answers those questions and more as you read on below…


Yes, a nearly 20% rally to start 2023 is a lot more fun for investors than the current pullback. Unfortunately, those kind of rallies are never built to last.

Now may not be as much fun…but it is more realistic.

So let’s focus on the current realities, and what happens next for the stock market in this week’s Reitmeister Total Return commentary…

Market Commentary

After a long bull run we are enduring a classic pullback to digest previous gains. My belief is that we will emerge into a new trading range where we will hang out for a while before the next leg higher.

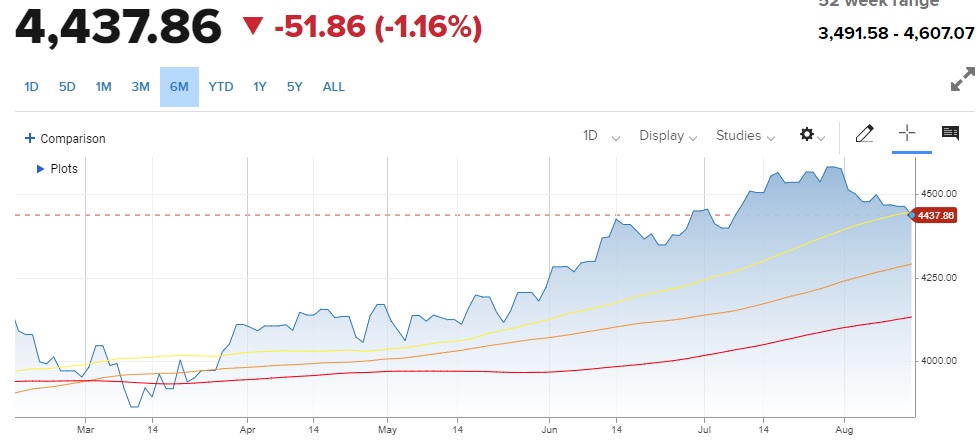
Moving Averages: 50 Day (yellow), 100 Day (orange), 200 Day (red)

4,600 for the S&P 500 (SPY) appears to be the top end of the range. Now we are trying to find the bottom.

As you can see Tuesday was the first test of the 50 day moving average since late May where we closed about 10 points below. Quite possible that support is found shortly and stocks bounce higher…but what if that is not the case?

I suspect that 4,400 could be ample area of support just 1% below the Tuesday close. That gives stocks a comfy 5% trading range to play in as we await the next catalyst.

Unfortunately, anything is possible and we could keep cutting lower to really clear out some of the complacency that comes with extended bull rallies. Yet, I don’t think that a test of the 200 day at 4,122 is in the cards. We would need some seriously negative events to emerge, like increased recession risk, to give that idea credence.

I suspect that 4,400 is likely as low as we need to go on this pullback. But if worse comes to worst, maybe a more serious washout down to the 100 day moving average at 4,284 is in the offing. That would not be so terrible given that the year started just a notch above 3,800.

Trading ranges are a time when investors have not fully made up their mind on what to do next. This makes stock prices very susceptible to the future crop of headlines.

Meaning that more positive/bullish events will have stocks bolting higher. Whereas more negative/bearish events will have the reverse effect, pushing stocks further lower.

This makes it important for us to review the upcoming events calendar to see what could be the next big move catalyst:

First, a backdrop that the last GDP reading was +2.4% for Q2. And the current Atlanta GDP Now estimate stands at +5.0% for the Q3. There is no way it will end up that high. Yet it does explain why the long term outlook is primarily bullish.

Point being that right now the view of the economy is positive. Thus, these upcoming announcements could either further bolster that notion…or call that rosy outlook into question.

8/16 FOMC Minutes: The Fed did finally start their “dovish tilt” at the late July meeting. Now investors will pour through the minutes for more clues of the likelihood of future rate hikes. Right now investors are betting on much greater likelihood they are done raising rates. The key question being when they start lowering rates. That event will be a bright green light for stock investors.

8/23 PMI Flash: This report rarely makes headlines, but is a strong leading indicator of the trends found in the next round of ISM Manufacturing & Services reports the first week of the new month. Thus, always beneficial to review this announcement to appreciate if odds of recession are going higher or lower.

9/1 Government Employment Situation: This continues to ebb lower as the Fed rate hikes slow down the economy. But gladly has not tipped over into negative territory that would raise the unemployment rate…and risk of recession. Right now the forecast calls for 180,000 jobs added which would be a very “Goldilocks” outcome where the unemployment rate would stay low. On the other hand, not so many jobs created as to heat up wage inflation that would concern the Fed.

9/1 ISM Manufacturing: This has been the weakest part of the economic picture with 9 straight readings in contraction territory (below 50). Right now, it seems that June may be the worst of these readings with July a notch higher…and the August reading on 9/1 expected to be another step in the right direction.

9/6 ISM Services: This is the larger, and healthier part of the economy leading to the positive GDP readings. It is currently expected to be somewhat in line with last month’s 52.7 reading, which is modestly in expansion territory. However, Tuesday’s impressive Retail Sales report may have estimates for this report moving higher in the days ahead.

9/13 Consumer Price Index (CPI): Inflation reports are the most telling of what the Fed will do with future rate hike decisions. Gladly this key inflation report has been moderating faster than expected for quite some time. Thus, that positive trend staying in place will be key to reignite bullish sentiment.

Trading Plan

As shared above, I think we are enduring a long overdue pullback to take the ripe early 2023 profits off the table. The main question is how low we need to go to find the bottom?

From the outset I had my eyes set on 4,400 as a logical bottom…but who says the stock market is logical?

The point is that I am using this pullback to stock up on the best trades for the eventual rise back to the top of the range…and likely flirting with the all time highs of 4,818 by the time we close the books on 2023.

One always feels foolish buying stocks early in a pullback as these new trades will just show red arrows for a while. But since this pullback is only temporary before the next leg higher…and perfect timing is nearly impossible…then it’s better to be too early, than too late.

Meaning that now is as good of a time as any to load up on the best stocks. Which are those? That is what the next section will discuss…

What To Do Next?

Discover my current portfolio of 6 stocks packed to the brim with the outperforming benefits found in our POWR Ratings model.

Plus I have added 4 ETFs that are all in sectors well positioned to outpace the market in the weeks and months ahead.

This is all based on my 43 years of investing experience seeing bull markets…bear markets…and everything between.

If you are curious to learn more, and want to see these 10 hand selected trades, then please click the link below to get started now.

Steve Reitmeister’s Trading Plan & Top Picks >

Wishing you a world of investment success!


SPY shares rose $0.03 (+0.01%) in after-hours trading Tuesday. Year-to-date, SPY has gained 16.68%, versus a % rise in the benchmark S&P 500 index during the same period.


About the Author

Steve is better known to the StockNews audience as “Reity”. Not only is he the CEO of the firm, but he also shares his 40 years of investment experience in the Reitmeister Total Return portfolio. Learn more about Reity’s background, along with links to his most recent articles and stock picks.

4 Stocks Set to Benefit From Natural Gas Pipeline


Natural gas is used as a fuel to make materials and chemicals. It is also used for electricity generation, heating, cooking, and as a transportation fuel. In the United States, natural gas accounts for about 30% of the energy used. The exploration, drilling, and production of natural gas affect the environment and is one of the significant contributors to climate change.

The ambitious Mountain Valley Pipeline (MVP) project has been in the news lately. It is a natural gas pipeline system that spans about 303 miles from northwestern West Virginia to southern Virginia. It will be regulated by the Federal Energy Regulatory Commission (FERC).

The pipeline has faced several challenges since construction began in 2018. The project found opposition from groups that claimed it would contribute to climate change by increasing the use of natural gas.

The project got a boost after President Biden signed the debt limit bill, which canceled the $31.4 trillion debt ceiling. Raising the national debt ceiling helped acquire the necessary permits, authorization, and verifications for Mountain Valley’s construction and initial operation at full capacity.

Earlier this year, Energy Secretary Jennifer Granholm, in a letter to the Federal Energy Regulatory Commission, said, “MVP project will enhance the Nation’s critical infrastructure for energy and national security.”

On August 11, 2023, a three-judge panel of the 4th U.S. Circuit Court of Appeals in Richmond, Virginia, rejected a challenge to the federal approvals for the Mountain Valley Pipeline, ending the long legal battles which have delayed its construction and operation.

On July 27, the U.S. Supreme Court lifted orders of temporarily blocking construction issued by the 4th U.S. Circuit Court of Appeals in the final 3.5-mile section of the pipeline, dealing a blow to the environmental groups protesting against the pipeline construction. The pipeline will transport natural gas from the Marcellus and Utica shale formations to the growing markets of the mid-Atlantic and southeastern regions of the United States.

The MVP will have a delivery capacity of 2 billion cubic feet per day of natural gas, approximately one-third of marketed natural gas produced in West Virginia. The MVP will ensure reliable and affordable access to domestic energy while providing national energy security at the same time.

Although the project is due for completion this year, the Pipeline and Hazardous Materials Safety Administration have notified MVP’s owner Equitrans Midstream to undertake safety inspections across the 300-mile project. The agency wants the safety inspections to be conducted as the segments of pipe left exposed or buried since the project’s inception could pose a safety risk.

In a Notice of Proposed Safety Order, the agency said, “The commissioning and operation of the MVP pipeline without appropriate inspection and corresponding corrective measures first being undertaken would pose a pipeline integrity risk to public safety, property, and the environment.”

Despite the order, the MVP project will likely come live this year. This is expected to benefit fundamentally strong natural gas companies like Shell plc (SHEL), Occidental Petroleum Corporation (OXY), Cheniere Energy, Inc. (LNG), and Chesapeake Energy Corporation (CHK).

Let’s discuss these stocks in detail.

Shell plc (SHEL)

Headquartered in London, the United Kingdom, SHEL operates as an energy and petrochemical company. The company operates Integrated Gas, Upstream, Marketing, Chemicals and Products, and Renewables and Energy Solutions segments. It explores for and extracts crude oil, natural gas, and natural gas liquids; markets and transports oil and gas; produces gas-to-liquids fuels and other products.

On February 20, 2023, SHEL’s wholly owned subsidiary Shell Petroleum NV, announced the completion of the acquisition of 100% of the shares of Nature Energy Biogas A/S (Nature Energy). Nature Energy is Europe’s largest renewable natural gas (RNG) producer. The acquisition would help SHEL build an integrated RNG value chain globally and profitably grow its low-carbon offerings to customers across different sectors.

On July 25, 2023, SHEL’s subsidiary Shell Upstream Overseas Services (I) Limited, announced that it had agreed to sell its participating interest in Indonesia’s Masela Production Sharing Contract to Indonesia’s PT Pertamina Hulu Energi and Petronas Masela Sdn. Bhd. SHEL’s Integrated Gas and Upstream Director said, “The decision to sell our participation in the Masela PSC is in line with our focus on disciplined capital allocation.”

In terms of the trailing-12-month levered FCF margin, SHEL’s 8.72% is 42.3% higher than the 6.13% industry average. Likewise, its 12.27% trailing-12-month Return on Total Capital is 18% higher than the industry average of 10.40%. Furthermore, the stock’s 0.83x trailing-12-month asset turnover ratio is 36.1% higher than the industry average of 0.61x.

In terms of forward non-GAAP P/E, SHEL’s 7.33x is 29.9% lower than the 10.45x industry average. Its 3.56x forward EV/EBITDA is 38.7% lower than the 5.80x industry average. Likewise, its 5.32x forward EV/EBIT is 44.3% lower than the 9.56x industry average.

SHEL’s revenue for the second quarter ended June 30, 2023, declined 25.5% year-over-year to $74.58 billion. Its adjusted earnings decreased 55.8% year-over-year to $5.07 billion. Its adjusted EBITDA declined 37.6% over the prior-year quarter to $14.44 billion. The company’s adjusted EPS came in at $0.75, representing an increase of 51.3% year-over-year.

Analysts expect SHEL’s EPS and revenue for fiscal 2024 to increase 2.5% and 3.3% year-over-year to $8.49 and $352.16 billion, respectively. It surpassed the consensus EPS estimates in three of the trailing four quarters. Over the past year, the stock has gained 15.1% to close the last trading session at $60.68.

Occidental Petroleum Corporation (OXY)

OXY engages in acquiring, exploring, and developing oil and gas properties. It operates through three segments: Oil and Gas, Chemical, and Midstream and Marketing.

On August 15, 2023, OXY announced the acquisition of Carbon Engineering Ltd. for $1.1 billion to help it develop a string of carbon-capture sites. OXY President and CEO Vicki Hollub said, “We expect the acquisition of Carbon Engineering to deliver our shareholders value through an improved drive for technology innovation and accelerated DAC cost reductions.”

“The technology partnership also adds new revenue streams in the form of technology licensing and royalties. Importantly, the acquisition enables Occidental to catalyze broader development partnerships for DAC development in the most capital-efficient and valuable way,” she added.

In terms of the trailing-12-month net income margin, OXY’s 21.55% is 53.3% higher than the 14.06% industry average. Likewise, its 51.70% trailing-12-month EBITDA margin is 38.2% higher than the industry average of 37.40%. Furthermore, the stock’s 18.31% trailing-12-month Capex/Sales is 33.9% higher than the industry average of 13.68%.

In terms of forward non-GAAP P/E, OXY’s 17.01x is 62.7% higher than the 10.45x industry average. Its 6.02x forward EV/EBITDA is 3.8% higher than the 5.80x industry average. Likewise, its 2.69x forward Price/Book is 60.8% higher than the 1.67x industry average.

For the second quarter ended June 30, 2023, OXY’s revenues and other income declined 37.3% year-over-year to $6.73 billion. Its adjusted income attributable to common stockholders decreased 79.6% over the prior-year quarter to $661 million. Its adjusted EPS came in at $0.68, representing a decline of 78.5% year-over-year.

Street expects OXY’s EPS for the quarter ending March 31, 2024, to increase 6.2% year-over-year to $1.16. Its revenue for fiscal 2024 is expected to increase 3.3% year-over-year to $28.81 billion. Over the past three months, the stock has gained 7.6% to close the last trading session at $62.55.

Cheniere Energy, Inc. (LNG)

LNG is an energy infrastructure company that is engaged in LNG-related businesses. The company provides clean, secure LNG to integrated energy companies, utilities, and energy trading companies worldwide. The company owns and operates two natural gas liquefaction and export facilities at the Sabine Pass LNG and Corpus Christi LNG terminals. It also owns the Creole Trail pipeline.

On June 26, 2023, LNG announced that its subsidiary Cheniere Marketing, LLC, entered into a long-term liquefied natural gas sale and purchase agreement with ENN LNG (Singapore) Pte. Ltd., a wholly-owned subsidiary of ENN Natural Gas Co., Ltd. ENN agreed to purchase approximately 1.8 million tonnes per annum of LNG under the sale and purchase agreement.

In terms of the trailing-12-month EBIT margin, LNG’s 48.11% is 98.9% higher than the 24.18% industry average. Likewise, its 52.11% trailing-12-month EBITDA margin is 39.3% higher than the industry average of 37.40%. Furthermore, the stock’s 0.70x trailing-12-month asset turnover ratio is 14.8% higher than the industry average of 0.61x.

In terms of forward non-GAAP P/E, LNG’s 7.83x is 25.1% lower than the 10.45x industry average. Its 5.12x forward EV/EBIT is 46.5% lower than the 9.56x industry average.

On the other hand, its 7.57x forward EV/EBITDA is 30.4% higher than the 5.80x industry average.

LNG’s revenues for the second quarter ended June 30, 2023, declined 48.8% year-over-year to $4.10 billion. Its consolidated adjusted EBITDA decreased 26.5% over the prior-year quarter to $1.86 billion. The company’s net income attributable to common stockholders rose 84.8% year-over-year to $1.37 billion. Also, its EPS came in at $5.61, representing an increase of 93.4% year-over-year.

For fiscal 2023, LNG’s EPS is expected to increase 479.3% year-over-year to $32.67. It surpassed the Street EPS estimates in three of the trailing four quarters. Over the past three months, the stock has gained 12.1% to close the last trading session at $160.19.

Chesapeake Energy Corporation (CHK)

CHK is an independent exploration and production company that engages in acquiring, exploring, and developing properties to produce oil, natural gas, and natural gas liquids from underground reservoirs in the United States. The company holds an interest in natural gas resource plays in the Marcellus Shale in the northern Appalachian Basin in Pennsylvania and the Haynesville/Bossier Shales in northwestern Louisiana.

On August 14, 2023, CHK announced its agreement to sell its remaining Eagle Ford assets to SilverBow Resources, Inc. (SBOW) for $700 million, taking the total proceeds from the Eagle Ford exit to more than $3.5 billion.

CHK’s President and CEO Nick Dell’Osso said, “We are pleased to have successfully completed the exit of our Eagle Ford asset, allowing us to focus our capital and team on the premium rock, returns, and runway of our Marcellus and Haynesville positions.”

In terms of the trailing-12-month net income margin, CHK’s 58.38% is 315.4% higher than the 14.06% industry average. Likewise, its 60.28% trailing-12-month EBITDA margin is 61.2% higher than the industry average of 37.40%. Furthermore, the stock’s 19.55% trailing-12-month Capex/Sales is 43% higher than the industry average of 13.68%.

In terms of forward EV/EBITDA, CHK’s 4.95x is 14.8% lower than the 5.80x industry average. Its 8.33x forward EV/EBIT is 12.9% lower than the 9.56x industry average. Likewise, its 1.11x forward Price/Book is 33.5% lower than the 1.67x industry average.

On the other hand, its 2.79x forward Price/Sales is 87.3% higher than the 1.49x industry average. Its 3.10x forward EV/Sales is 39.2% higher than the 2.23x industry average.

CHK’s total revenues and other income for the second quarter ended June 30, 2023, declined 46.3% year-over-year to $1.89 billion. Its net income available to common stockholders decreased 68.4% year-over-year to $391 million. Also, its EPS came in at $2.73, representing a decline of 67% year-over-year.

Analysts expect CHK’s EPS and revenue for fiscal 2024 to increase 45.5% and 1.5% year-over-year to $6.28 and $3.98 billion, respectively. It surpassed the consensus EPS estimate in each of the trailing four quarters. Over the past three months, the stock has gained 4.1% to close the last trading session at $82.58.

Consumer Lawsuit Threatens to Shake Tesla (TSLA) Stock – What's at Stake?

Electric vehicle (EV) pioneer Tesla, Inc. (TSLA) has revolutionized the battery-electric vehicle market. Despite rising competition from legacy automakers, TSLA remains the top EV seller in the United States. During the year's first half, TSLA sold 336,892 vehicles, nearly 300,000 units higher than the second-largest EV seller.

However, the Austin, Texas-based automaker faces a lawsuit from three customers over its vehicles’ driving range estimates. The proposed class action lawsuit accuses the company of falsely advertising the driving ranges of its electric vehicles.

On August 2, 2023, the lawsuit was filed in the U.S. District Court for the Northern District of California. The lawsuit alleges that TSLA “marketed its electric vehicles as having a grossly overvalued range in an effort to increase sales to consumers.” TSLA faces charges of fraud and breach of warranty, among others.

The lawsuit followed a Reuters article that alleged that TSLA had created a “Diversion Team” in Las Vegas to cancel as many range-related appointments as possible after its service centers got flooded with complaints from owners who expected a better performance from their vehicles based on the company’s advertised estimates and the projections displayed by the in-dash range meters of the vehicles.

The team aimed to divert as many appointments as possible to help save TSLA $1,000 per visit. The investigative article, which came out on July 27, 2023, also revealed how the company began exaggerating the range of its vehicles by rigging the range-estimating software years ago.

A person familiar with the matter said that the automaker had decided a decade ago that it would write algorithms for its range meter to show drivers rosy range projections on a full battery. He added that these optimistic range estimate directives came from CEO Elon Musk a decade ago.

The source said, “Elon wanted to show good range numbers when fully charged. When you buy a car off the lot seeing 350-mile, 400-mile range, it makes you feel good.” However, the news agency could not verify whether the automaker still uses algorithms to boost in-dash range estimates.

Earlier this year, TSLA was fined ₩2.85 billion ($2.13 million) by South Korean regulators as they found that their cars delivered as little as half their advertised range in cold weather. The Korea Fair Trade Commission (KFTC) found that TSLA cars driving range plunged in cold weather by up to 50.5% versus how they were advertised online.

TSLA’s stock has declined 17.2% in price over the past month. However, the stock is still up 89.1% year-to-date.

Here’s what could influence TSLA’s performance in the upcoming months:

Robust Financials

TSLA’s total revenues for the second quarter ended June 30, 2023, increased 47.2% year-over-year to $24.93 billion. Its non-GAAP net income attributable to common stockholders increased 20.2% year-over-year to $3.15 billion. Its adjusted EBITDA rose 22.7% year-over-year to $4.65 billion. The company’s non-GAAP EPS came in at $0.91, representing an increase of 19.7% year-over-year.

Mixed Analyst Estimates

TSLA’s EPS for fiscal 2023 is expected to decline 15.3% year-over-year to $3.45. On the other hand, its revenue for fiscal 2023 is expected to increase 22.9% year-over-year to $100.09 billion. Its EPS and revenue for fiscal 2024 are expected to increase 42.7% and 28.5% year-over-year to $4.92 and $128.66 billion, respectively.

Its EPS for the quarter ending September 30, 2023, declined 22.8% year-over-year to $0.81. Its revenue for the same quarter is expected to increase 16% year-over-year to $24.89 billion.

Stretched Valuation

In terms of forward EV/EBITDA, TSLA’s 41.69x is 324.2% higher than the 9.83x industry average. Likewise, its 7.42x forward EV/S is 519.5% higher than the 1.20x industry average. Its 69.58x forward non-GAAP P/E is 341.1% higher than the 15.78x industry average.

High Profitability

In terms of the trailing-12-month EBITDA margin, TSLA’s 17.86% is 66.4% higher than the 10.74% industry average. Likewise, its 12.97% trailing-12-month net income margin is 210.5% higher than the 4.18% industry average. Additionally, its 1.18x trailing-12-month asset turnover ratio is 18.5% higher than the 1x industry average.

Bottom Line

TSLA faces some severe allegations of fraud and breach of warranty. The class action lawsuit against the company could help customers get some money spent on the cars and probably force the automaker to change how it advertises its vehicles’ driving ranges.

However, the stock has not reacted too negatively to the headlines around the lawsuit. Recently, TSLA launched cheaper versions of its popular Model S and Model X vehicles in the United States, having a shorter range. This move comes after the automaker undertook price cuts in China on its Model Y and Model 3 vehicles. The company has been focusing on volume growth by cutting prices across its product range.

However, investors remain concerned over its falling gross margins as the company focuses on volume growth. Given the mixed analyst estimates and the possibility of a fine arising from the class action lawsuit, it could be wise to wait for a better entry point in the stock.