Home on the Trading Range

Please enjoy this updated version of weekly commentary from the Reitmeister Total Return newsletter. Steve Reitmeister is the CEO of StockNews.com and Editor of the Reitmeister Total Return.Click Here to learn more about Reitmeister Total Return


SPY – The nearly 20% bull run for the S&P 500 (SPY) from the March lows is over. Now it’s time to rest up in a trading range for the next run higher. Meaning this is the natural course of things. To relax after a hard run…and then store up the required energy for the next sprint. The best part is how we can use these more range bound periods to buy the dip on some stocks with terrific upside potential. Let’s talk about how we will do just that in this week’s Reitmeister Total Return commentary.


We FINALLY saw the stock market take a step back after a seeming non-stop 5 month rally. Many investment commentators point to the Fitch ratings downgraded of US debt as the primary cause. However, if we are being honest with ourselves….this self off was long overdue. The Fitch announcement was just a convenient excuse to hit the sell button for a while.

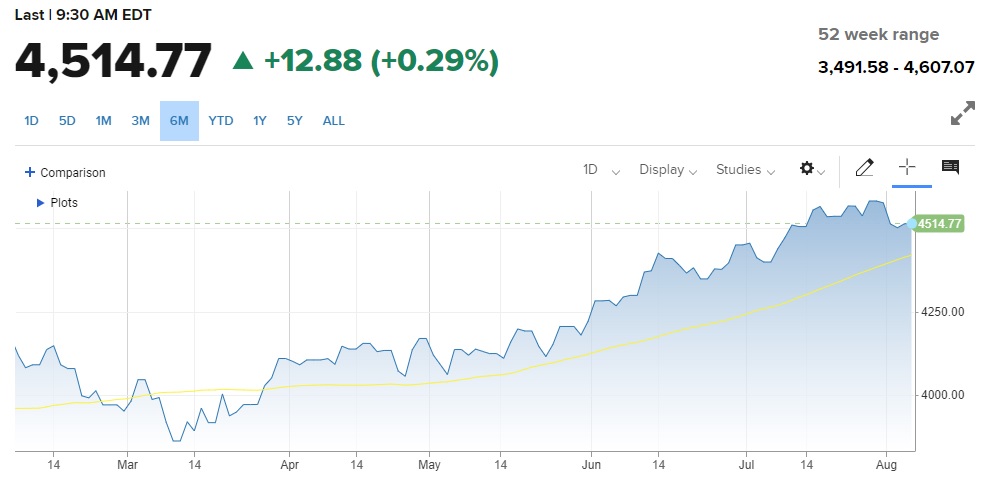
Friday was an interesting session worthy of note. The Government Employment Report seemed like a Goldilocks announcement. Not too hot…not too cold…just right helping the S&P 500 rise nearly 1% early in the session.

Yet as the day progressed those gains melted off the board leading to a -0.53% session. Even more interesting was the S&P 500 (SPY) closing below 4,500 and now probably on our way towards 4,400 (more on that in the Price Action section below.)

Even though we don’t like seeing red on the screen…this is healthy. That investors took the opportunity of an intraday rally to take more gains off the table.

On Monday we got a solid bounce back as investors have gotten into the habit of buying every dip the past several months as that strategy has paid off handsomely. What they didn’t know was a surprise announcement on Monday that Moody’s was downgrading their ratings on a slew of small to midsized banks. This reawakened the Risk Off sentiment from last week with more investors hitting the sell button in earnest on Tuesday.

This is the classic swinging of the fear/greed pendulum. The greed of the rally up to 4,600 was overextended. Simply conditions were not that pristine to keep rising. This left investors vulnerable to any bad news for which Fitch and Moody’s were reminders that the overall market may be ahead of itself.

Another reminder of this is on the earnings front. As we come down the homestretch of Q2 earnings season we find that earnings estimates for the future have been trimmed for the next few quarters. Adding those 3 quarters together points to virtually no year over year growth.

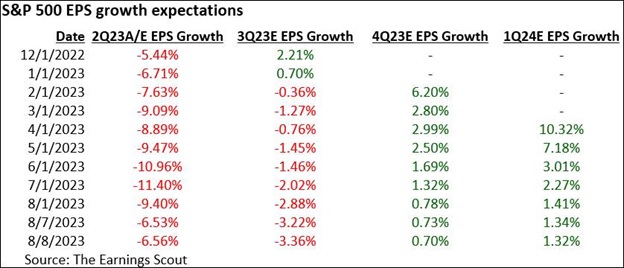
The weak earnings outlook is NOT GOOD FUEL FOR A BULL RALLY

Especially true when the S&P 500 is already at a PE of 20. That is not necessarily overpriced…but it is rather fully priced. Thus, to reasonably expect more upside you need better earnings growth prospects for the future to compel higher prices without overly inflating PE.

This is a long way of saying that now is a logical time for the runaway rally to end and for us to enter a healthy consolidation period to digest recent gains. And thus be more selective about the stocks that should advance from here.

So Why Still Believe in a Long Term Bull Rally?

Because the Fed is providing more hints of a “dovish tilt”. That gained steam with the speech from Harken of the Philly Fed where he stated that likely no further rate hikes are needed. At this stage they just need to give the current high rates time to sink in and bring down inflation further. Then start thinking about lower rates.

Plain and simple, the future lowering of rates is a tail wind for the economy that increases the odds of better growth prospects (what is needed to push prices higher). Knowing that is on the horizon is a reason to be more bullish now.

On top of that you have more business people feeling optimistic about the future. Here is the chart for the NFIB Small Business Optimism reading on Tuesday morning at 91.9.

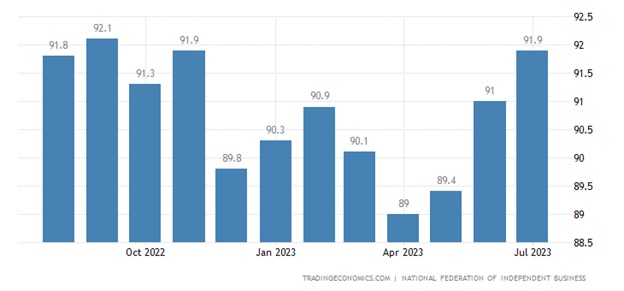
As you can see this is the 3rd straight month of improvement and the highest reading in quite a while. This increased optimism is a precursor to improving growth trends.

Think about this. First you feel good about something…then you act on that positive impulse. This is why sentiment surveys are considered leading indicators of future economic activity.

Putting it altogether there is stronger reasons to believe that recession will be avoided during this rate hike cycle. If so, then the economy should pick up from here…which lifts earnings prospects…which is necessary fuel for share price appreciation.

Price Action & Trading Plan

Here is the updated S&P 500 chart:

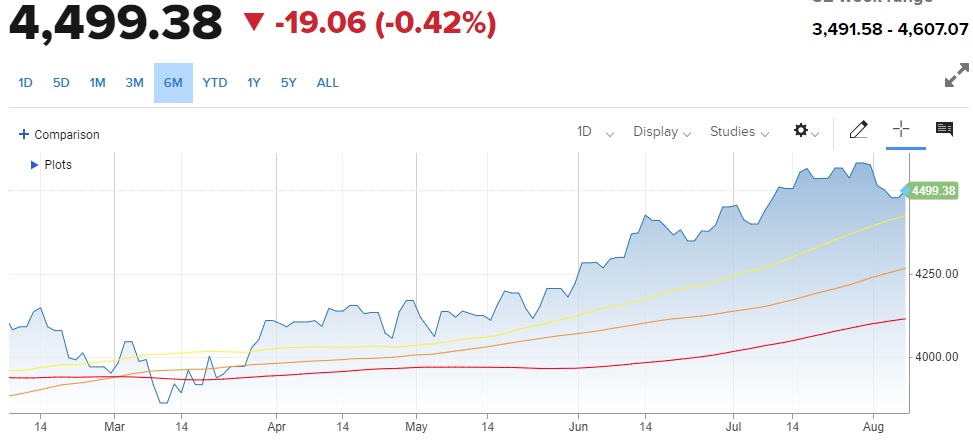
Moving Averages: 50 Day (yellow), 100 Day (orange), 200 Day (red)

Right now 4,600 is setting up as a spot of stiff resistance and now trying to find support on the underside for likely a trading range to form. My guess is that the 50 day moving average around 4,420 is about as low as stocks need to go.

This sets up for a trading range where we likely swim around for a few months before the typical holiday rallies of November/December kick in giving us a real shot at the previous all time high of 4,818.

This sets us up nicely for a stock pickers market which is my favorite. Meaning where the overall market is kind of lukewarm…but those with a stock picking advantage find way to carve out profits.

In our case, the POWR Ratings is a big advantage in our corner to find stock picking profits in any market environment…especially an environment where the leaders are overripe and investors will rotate to more attractive, underpriced plays.

What To Do Next?

Discover my current portfolio of 5 stocks packed to the brim with the outperforming benefits found in our POWR Ratings model.

Plus I have added 4 ETFs that are all in sectors well positioned to outpace the market in the weeks and months ahead.

This is all based on my 43 years of investing experience seeing bull markets…bear markets…and everything between.

If you are curious to learn more, and want to see these 9 hand selected trades, then please click the link below to get started now.

Steve Reitmeister’s Trading Plan & Top Picks >

Wishing you a world of investment success!


SPY shares fell $0.10 (-0.02%) in after-hours trading Tuesday. Year-to-date, SPY has gained 18.23%, versus a % rise in the benchmark S&P 500 index during the same period.


About the Author

Steve is better known to the StockNews audience as “Reity”. Not only is he the CEO of the firm, but he also shares his 40 years of investment experience in the Reitmeister Total Return portfolio. Learn more about Reity’s background, along with links to his most recent articles and stock picks.


Roku’s (ROKU) Prospects Post-Cathie Wood's $13 Million Move: Buy or Wait?

TV streaming platform Roku, Inc. (ROKU) has been going through a purple patch. According to Nielsen, while viewing hours on traditional TV in the U.S. declined by 13% year-over-year, ROKU’s users streamed 25.1 billion hours in Q2, representing 3.8 Streaming Hours per Active Account per day, up 21% year-over-year.

Consequently, for the fiscal second quarter that ended June 30, ROKU surpassed Street expectations by increasing its revenue by 10.8% year-over-year to $847.2 million and narrowing its loss by 7.3% year-over-year to $0.76 per share.

This outperformance triggered a rally of nearly 10%, which has resulted in the stock surging by more than 45% and 96% over the past six months and year-to-date, respectively.

Beyond the financial performance, on June 27, ROKU announced that it would become the U.S. streaming home of Formula E, the electric vehicle-powered auto racing series, with live and on-demand replays of races. This has made it the company’s first-ever live sports rights package at a time when streaming companies are rushing to secure sports broadcasting rights amid growing industry competition.

The company launched Roku-branded TVs (the first TVs designed and made by Roku) in March to offer consumers even more choices and enable more innovation across the Roku TV program. Best Buy is the exclusive retailer for TV, and all 11 TV models have received strong industry reviews and customer ratings of 4.5 (out of 5) stars or higher.

More recently, on August 3, Miss Universe signed a multi-year broadcasting deal with the channel, and on August 10, WildBrain landed multiple kids’ series.

Moreover, in July, ROKU announced partnerships with FreeWheel and Shopify Inc. (SHOP) to bring a suite of industry solutions to unlock the full value of streaming TV for advertisers and publishers and the ability to purchase products from SHOP merchants directly from their TV through Roku Action Ads for viewers, respectively.

Given the tailwinds, for the fiscal third quarter, ROKU expects total net revenue of roughly $815 million and a total gross profit of roughly $355 million. Moreover, Statista forecasts the number of U.S. households with cable TV packages to be down 40% from a decade earlier.

Hence, it’s unsurprising to find analysts expecting ROKU’s revenue to increase by 7.6% year-over-year to $3.36 billion in 2023 and by another 15.3% to $3.88 billion in 2024.

However, anticlimactically, Cathie Wood, the founder, CEO, and CIO of Ark Invest, an investment management firm whose flagship fund, ARK Innovation ETF (ARKK), sold shares of ROKU worth $13.1 million.

ARKK, which seeks to generate long-term capital appreciation by investing in businesses across the globe that seek to benefit from disruptive innovation, alone sold 138,221 shares of ROKU. Despite the sale, the AMC still owns 8,697,614 shares of the streaming company, valued at around $770 million, and the holding is weighted at 9.3% of ARKK's portfolio.

Nevertheless, the $13 million move, albeit amounting to a little above 1% of ARK’s stake in ROKU, has raised eyebrows. However, the move makes sense in the context of valuation.

In terms of the forward EV/Sales multiple, ROKU is trading at 3.11, which is 66.4% above the industry average of 1.87. Similarly, the stock’s forward Price/Sales and Price/Book multiples of 3.43 and 4.93 are significantly higher than the respective industry averages of 1.22 and 1.99.

Such a frothy valuation seems unsustainable for a company that’s yet to turn in a profit and is operating in a competitive and overcrowded sector that has of late found the going tough due to an attention recession to the reopening of the economy after the pandemic, softened demand due to a year-long ordeal with inflation, muted TV advertising, and, of all things, strikes among Hollywood actors and writers.

Hence, while the stock is still trading above its 50-day and 200-day moving averages of $71.84 and $60.05, respectively, it is not difficult to see how the tide might have already begun turning. Moreover, with a 5-year beta of 1.76, volatility also remains an issue.

Bottom Line

In view of the above, it could be wise for investors to hold their horses and wait for ROKU to become profitable or for its valuation to become more attractive before acquiring a stake in the streaming giant, aspiring to go full steam ahead.

The U.S. Dollar Is DOWN. Start Investing in These 5 Safe Haven Assets

With the latest hike, Jerome Powell and his team at the Federal Reserve raised the benchmark borrowing cost to 5.25%-5.50%, thereby ratcheting it up from nearly 0% in  16 months.

While a 2.6% rise in inflation, down from a 4.1% rise in Q1 and well below the estimate for an increase of 3.2%, and an annualized increase of 2.4% in the gross domestic product in the second quarter, topping the 2% estimate, had raised hopes that the elusive “soft landing” could be within reach, recent developments have been less than encouraging.

Despite the falling unemployment rate, the number of jobs created in July came in lower than expected, which could be symptomatic of an economy slowly but surely footing the bill of aggressive interest-rate hikes. Moreover, with a more-than-forecasted increase in wages, there are increasing concerns that interest rates could stay higher for longer.

To compound the miseries further, after placing the country on negative watch amid the debt-ceiling standoff at Capitol Hill back in May, Fitch Ratings recently downgraded U.S. long-term rating to AA+ from AAA, citing the erosion of confidence in fiscal management.

As a result, despite the salvo of interest-rate hikes, the dollar has recently weakened in relation to its peers. The dollar index, a measure of the U.S. currency against six peers, fell 0.185%. The euro edged up 0.31% to $1.0978, and the yen strengthened 0.16% at 142.31 per dollar.

Moreover, with every increase in benchmark interest rates, a selloff of long-duration fixed-income instruments, such as the 10-year treasury notes, gets triggered, which causes a slump in their market value and a consequent increase in their yields.

After benchmark 10-year yields jumped by as much as 15 basis points above the key 4% level, Peter Schiff, CEO and chief economist at Euro Pacific Asset Management, warned of a crash in Treasuries. He has also predicted the benchmark 30-year mortgage rates to soon hit 8%, a level last seen in 2000.

An increase in borrowing costs would not just raise the cost of servicing the $32.7 trillion national debt; significant markdowns prices of legacy bonds and an inability by borrowers to service them due to economic slowdown could crush the loan portfolios of struggling banks and make them go the way of the dodo, such as the Silicon Valley Bank and the First Republic Bank.

Hence, it is unsurprising that Moody’s has cut ratings of 10 U.S. banks and put some big names on downgrade watch, and HSBC Asset Management’s warning that a U.S. recession is coming this year, with Europe to follow in 2024 is gaining credibility with each passing day.

With a material risk that an apparently resilient economy could find itself regressing into a full-blown recession just as Jerome Powell’s colleagues at the Federal Reserve have stopped forecasting it, seasoned investors could be wise to seek refuge in anti-fragile assets which could see upside potential in the event of a turmoil.

Since a devaluation in domestic currency brightens the prospects of exports, one of the ways to navigate the terrain is to bet on U.S. companies generating international sales, which could benefit from an uptick in earnings.

Secondly, since the value of gold has usually been negatively correlated to the global reserve currency, the demand for yellow metal from central banks worldwide totaled 1,136 tons in 2022.

In view of the above, here are a few financial instruments that could be worthy of consideration:

QUALCOMM Incorporated (QCOM)

QCOM is engaged in developing and commercializing foundational technologies for the global wireless industry. The company operates through three segments: Qualcomm CDMA Technologies (QCT), Qualcomm Technology Licensing (QTL), and Qualcomm Strategic Initiatives (QSI).

Over the past three years, QCOM’s revenue has grown at a 24.5% CAGR, while its EBITDA has grown at a 34.4% CAGR. During the same time horizon, the company has been able to increase its net income at 46.4% CAGR.

On July 14, QCOM announced its quarterly cash dividend of $0.80 per common share, payable on September 21, 2023, to stockholders of record at the close of business on August 31, 2023.

QCOM pays $3.20 annually as dividends. Its 4-year average dividend yield is 2.32%. The company has been able to increase its dividend payouts for the past 19 years and at a 5.5% CAGR for the past five years.

For the fiscal third quarter that ended June 25, QCOM’s non-GAAP revenues came in at $8.44 billion, with QCT automotive posting an 11th straight quarter of double-digit revenue growth, while its non-GAAP net income amounted to $2.16 billion, or $1.87 per share.

Analysts expect QCOM’s revenue and EPS for the fiscal fourth quarter to exhibit marginal sequential increases to come in at $8.50 billion and $1.90, respectively. It corresponds to the midpoint of the company’s guidance for the quarter. Moreover, QCOM has met or exceeded consensus EPS estimates in three of the trailing four quarters.

Schlumberger N.V. (SLB)

As a global technology company, SLB primarily offers oilfield services to national oil companies, integrated oil companies, and independent operators. The company operates through four segments: Digital & Integration, Reservoir Performance, Well Construction, and Production Systems.

SLB has grown its revenue and EBITDA at 1.8% and 7% CAGRs, respectively.

On July 26, SLB and Eni S.p.A. (E), through its subsidiary Enivibes, announced an alliance to deploy e-vpms® (Eni Vibroacoustic Pipeline Monitoring System) technology. The new proprietary pipeline integrity technology, capable of providing real-time analysis, monitoring, and leak detection for pipelines around the world, can be retrofitted to any pipeline, regardless of age.

The system would be capable of providing real-time analysis, monitoring, and leak detection for pipelines around the world.

On July 6. SLB announced that it had been awarded a five-year contract by Petroleo Brasileiro S.A.- Petrobras (PBR) for enterprise-wide deployment of its Delfi™ digital platform. The award represents one of PBR’s largest investments in cloud-based technologies and sets the foundation for it to achieve its decarbonization and net-zero targets. 

During the fiscal 2023 second quarter that ended June 30, SLB’s revenue increased by 19.6% year-over-year to $8.10 billion. The company’s adjusted EBITDA increased by 28.2% year-over-year to $1.96 billion during the same period. Consequently, its non-GAAP net income increased by 44% year-over-year to $1.03 billion and $0.72 per share.

Analysts expect SLB’s revenue and EPS for the fiscal third quarter to increase by 11.6% and 23.8% year-over-year to $8.35 billion and $0.78, respectively. The company has also impressed by surpassing consensus EPS estimates in each of the trailing four quarters.

SPDR Gold Trust ETF (GLD)

GLD is a world-renowned ETF launched and managed by World Gold Trust Services, LLC. It offers investors exposure to gold, which has of late become an important component of their asset allocation strategy by acting as a hedge against volatility in equity markets, inflation, and dollar depreciation.

With $56.10 billion in AUM, all of GLD’s holdings are in gold bullion, stored in secure vaults. The physically-backed nature of this product insulates this product from the uncertainties introduced through futures-based strategies.

GLD has an expense ratio of 0.40%, lower than the category average of 0.47%. The fund’s net inflow came in at $6.82 billion over the past five years. It has a beta of 0.15.

AFLAC Incorporated (AFL)

AFLAC is involved in the marketing and administration of supplemental health and life insurance. The company operates through two subsidiaries: American Family Life Assurance Company of Columbus (Aflac) and Aflac Life Insurance Japan Ltd. (ALIJ), which belong to the Aflac U.S.  and Aflac Japan segments, respectively.

Over the past three years, AFL has grown its EBITDA and net income at 6.6% and 16.1% CAGRs, respectively.

On July 25, AFL launched its new product, Aflac Group Life Term to 120, to provide worksite life insurance, flexible living benefits, and affordable rates that won't increase across employees' lifespans. With flexible living benefits designed to make it easy to use whenever needed, the product assures customers of financial protection when needed.

During the fiscal 2023 second quarter that ended June 30, AFL’s total revenues came in at $5.17 billion, while its adjusted earnings excluding current period foreign currency impact increased by 3.6% and 10.2% year-over-year to come in at $979 million, or $1.62 per share, respectively.

Analysts expect AFL’s EPS for the fiscal third quarter to increase by 27% year-over-year to come in at $1.46. Moreover, the company has impressed by surpassing consensus EPS estimates in each of the

In addition to its robust financials, the relative immunity of its demand and margins to potential economic downturns make it an attractive investment option for solid risk-adjusted returns.

VanEck Vectors Gold Miners ETF (GDX)

GDX is managed by Van Eck Associates Corporation. It offers exposure to some of the largest gold mining companies in the world. Since their stocks strongly correlate to prevailing gold prices, the ETF provides indirect exposure to gold prices.

GDX has an expense ratio of 0.51%. It pays $0.48 annually as dividends, and its payouts have grown at a 22% CAGR over the past five years. It saw a net inflow of $68.53 million over the past month. The ETF has a beta of 0.77.

GDX has about $11.71 billion in assets under management (AUM). The ETF’s top holding is Newmont Corporation (NEM) which has a 10.04% weighting in the fund. It is followed by Barrick Gold Corporation (GOLD) at 9.04% and Franco-Nevada Corporation (FNV) at 8.31%. The fund has 52 holdings, with 61.81% of its assets concentrated in the top 10 holdings.

Palantir Technologies (PLTR) Fails to Surpass Wall Street Estimates: Buy or Sell?

Artificial Intelligence (AI) has been the buzzword of Wall Street this year. The AI-driven rally has propelled the Nasdaq Composite by 33.7% year-to-date. Palantir Technologies Inc. (PLTR) has also ridden this AI wave, returning more than 180% year-to-date.

Earlier this year, PLTR announced the launch of its newest offering, Artificial Intelligence Platform (AIP), for enterprise and military applications. AIP combines the capabilities of large language models (LLMs) like OpenAI’s GPT-4 or Google’s BERT with their proprietary software to enable responsible, effective, and compliant AI advantages for defense organizations and enterprise customers.

Commenting on AIP, PLTR’s CEO and Co-Founder Alex Karp said, “AIP will allow customers to leverage the power of our existing machine learning technologies alongside…large language models, directly in our existing platforms.” In a letter to shareholders, Karp said AIP has users in over 100 organizations, including the healthcare and automotive industries, and PLTR was in talks with more than 300 additional companies.

PLTR failed to surpass the consensus earnings and revenue estimates for the second quarter. Its EPS almost aligned with the analyst estimates, while its revenue missed the consensus revenue estimate marginally. In an interview at Bloomberg, PLTR CEO Karp stated, “We have a good chance at becoming the most important software company in the world.” He said that “demand is unprecedented” for its AI platform, AIP.

For the third quarter, PLTR expects its revenue to be between $553 million and $557 million. Its adjusted income from operations is expected to be between $135 million and $139 million. For fiscal 2023, the company raised its revenue guidance. Its revenue for the year is now expected to exceed $2.21 billion. However, the latest revenue outlook for fiscal 2023 is at the midpoint of analyst expectations of between $2.19 billion and $2.24 billion.

PLTR also raised its adjusted income from operations guidance to more than $576 million. Moreover, PLTR’s Board of Directors authorized a stock repurchase program of up to $1 billion based on what the company called “transformative” traction for its AI technology.

Commenting on its second-quarter performance, RBC Capital Markets analyst Rishi Jaluria said, “Given the heightened expectations of the stock from the retail investor base around Palantir being an AI beneficiary, these are kind of disappointing numbers.” Jaluria believes that PLTR is not truly a generative AI company, and it does not have anything truly differentiated when it comes to generative AI.

He said, “This really feels like the same Palantir services and technology that they’ve been selling, which has its value. They’re not actually adding a tremendous amount of value to be a leader in generative AI, even though they are positioning themselves as such in front of the investment community and even in front of CIOs and CEOs.” He has an underperform rating on the stock and a price target of $5.

However, Wedbush analyst Dan Ives is bullish on PLTR’s AI prospects. He stated, “That’s probably the best pure-play AI name, in terms of them monetizing not just on the government side, but on the enterprise side when it comes to AI.” Wedbush maintained an outperform rating on the stock with a price target of $25.

Jefferies analyst Brent Thill believes there are several unknowns in PLTR’s business. He considers that the timing recovery of its U.S. government business, its U.S. commercial growth's durability, and its AI platform's pricing strategy could cause near-term choppiness in the financials. He has a hold rating on the stock with a price target of $17.

Here’s what could influence PLTR’s performance in the upcoming months:

Robust Financials

PLTR’s revenue for the second quarter ended June 30, 2023, increased 12.7% year-over-year to $533.32 million. Its adjusted income from operations rose 25.2% over the prior-year quarter to $135.04 million. The company’s adjusted free cash flow increased 57.7% year-over-year to $96.03 million. Its adjusted EBITDA rose 27.2% over the prior-year quarter to $143.43 million.

In addition, its adjusted net income attributable to common stockholders came in at $119.55 million, compared to an adjusted net loss attributable to common stockholders of $21.12 million. Also, its adjusted EPS came in at $0.05, compared to an adjusted loss per share of $0.01 in the prior-year quarter.
Favorable Analyst Estimates

Analysts expect PLTR’s EPS for fiscal 2023 and 2024 to increase 300% and 7.3% year-over-year to $0.24 and $0.26. Its fiscal 2023 and 2024 revenue is expected to increase 16% and 18.9% year-over-year to $2.21 billion and $2.63 billion.

Its EPS and revenue for the quarter ending September 30, 2023, to increase 500% and 17.1% year-over-year to $0.06 and $559.37 million, respectively.

Stretched Valuation

In terms of forward EV/EBITDA, PLTR’s 60.82x is 300.3% higher than the 15.19x industry average. Likewise, its 16.08x forward EV/S is 454.1% higher than the 2.90x industry average. Its 74.96x forward non-GAAP P/E is 220.9% higher than the 23.36x industry average.

Mixed Profitability

In terms of the trailing-12-month gross profit margin, PLTR’s 78.75% is 63.4% higher than the 48.20% industry average. Likewise, its 21.35% trailing-12-month levered FCF margin is 193.3% higher than the industry average of 7.28%.

PLTR’s trailing-12-month net income margin is negative 12.87% compared to the 2.01% industry average. Likewise, its trailing-12-month Return on Common Equity is negative 10.04% compared to the 0.23% industry average. Furthermore, the stock’s negative 5.93% trailing-12-month EBIT margin compares to the industry average of 4.48%.

Solid Historical Growth

PLTR’s revenue grew at a CAGR of 34.8% over the past three years. Its total assets grew at a CAGR of 29.5% over the past three years. Moreover, its levered FCF grew at a CAGR of 88.5% over the past three years.

Bottom Line

The buzz around artificial intelligence has helped PLTR skyrocket this year. Its recently launched platform, AIP, is garnering attention as it will allow enterprises and defense and military organizations to integrate large language models (LLMs) with machine learning and AI to aid decision-making. AIP was launched with no pricing strategy, and according to PLTR’s CEO, it is aimed to “just take the whole market.”

The company told analysts that its new AI-related pilot programs are underway, but it’s still being determined when these programs will generate revenues. Without a revenue-generating timeline from its AIP platform, PLTR could witness investor interest in its AI platform fading slowly. On the other hand, the stock trades at an expensive valuation.

Given its mixed profitability, it could be wise to wait for a better entry point in the stock.

Stock Market Gets “Fitch Slapped”

Please enjoy this updated version of weekly commentary from the Reitmeister Total Return newsletter. Steve Reitmeister is the CEO of StockNews.com and Editor of the Reitmeister Total Return.Click Here to learn more about Reitmeister Total Return


SPY – The S&P 500 (SPY) seems to have hit a wall at 4,600 thanks in part to the surprising downgrade of US debt by the Fitch ratings service. Not only is that taking place, but investors also go served up the 3 key monthly economic reports that have market moving impact. Steve Reitmeister reviews this latest news to update his market outlook, trading plan and preview of 7 top picks. Get full details below…


Forgive my inner child for laughing so hard at this. But one of the greatest investment terms was coined this week in that the market got “Fitch Slapped”.

Meaning that the Fitch ratings downgrade for US debt slapped the investment world into submission this week. Not just a long overdue softening of stock prices as the S&P 500 (SPY) retreated from recent highs. There was also a reversal of course of long term bond rates as they headed higher once again.

Beyond that we also got served up the Big 3 economic reports this week. So there is much investment news to digest to plot our course in the days and weeks ahead.

Market Commentary

Plain and simple, the Fitch downgrade of US debt was the “Easy Button” excuse for a long overdue sell off. I don’t believe anyone is terribly worried about a debt crisis occurring any time soon.

That’s because there are several other large developed countries with as high if not higher levels of government debt vs. GDP. One of them will most certainly topple before the US like Japan, Italy, Spain, UK etc.

Yes…when those problems start to bubble up, THEN it’s time to get worried about US debt problems coming next which would be bad news for both the stock and bond market. In the meantime we are still in the midst of a new bull market where some recent gains needed to be taken off the table.

With the Fed looking ready to end the rate hike cycle, investors just want to make sure that the soft landing doesn’t devolve into a recession. To help us gauge that investors will look closely at the Big 3 economic reports this week.

First up was ISM Manufacturing on Tuesday. The 46.4 is no doubt a weak showing. But investors care more about the direction of things and what that means for the future.

As such, that reading was a step up from 46.0 in the previous month. Plus New Orders jumped from 45.6 to 47.3 which points to things getting better in the future.

On Thursday we got the ISM Services reading at 52.7 when 52.0 was expected. On top of that the New Orders was a healthy 55.0 which points to even better readings down the road.

However, if I were to point to a negative in these reports, both showed a noticeable drop in the Employment readings: 44.4 and 50.7 respectively. Combine that with the JOLTs report this week showing another reduction in job openings and it could be a sign that the jobs market is about to weaken.

Remember the changed language from the Fed at the late July meeting. They no longer expect a recession to emerge before their fight against high inflation is over. However, they do still predict a softening in economic growth and a slight increase in the unemployment rate.

That employment piece is a hard plane to land because often when the unemployment rate starts to rise…it keeps getting much worse than expected. That will means investors will probably be most focused on the employment part of the economic picture to best determine how bullish or bearish they want to be.

So that brings us around to the final, and most important part of the Big 3 economic reports. That being the Government Employment Situation report on Friday morning.

This was pretty much a Goldilocks type result. Not too hot…not too cold…just right.

The inline showing explains why stocks are bouncing Friday morning after a spate of recent weakness. However, it is was not all rainbows and lollipops.

The blemish is that the Fed has been very focused on wage inflation which has been too sticky. Indeed it stuck at +4.4% year over year when investors expected it slow down to 4.2%.

Even the month over month reading was higher than expected at +0.4% which points to nearly 5% annualized pace. This single point could have the Fed being a bit more stubborn with their hawkish rate plans.

Trading Plan

At this moment there is no reason to doubt that the bull market is still in place. However, stocks have been going up virtually non stop since March. That puts us in overbought territory…which makes now the perfect time place in which to see a 3-5% pullback before advancing higher.

This is healthy and normal. What pros often call “the pause that refreshes”.

I think the 50 day moving average (yellow line below) at 4,400 is a likely short term destination for stocks on the downside. This would help frame a comfortable 200 point trading range with 4,600 on the high side.


chart of 50-Day-Moving-Average-8-4-23


Note that I don’t think the S&P 500 ends the year much higher than the 4,600 level we just touched. Rather, most of the large caps leading that index have already had their fun. Instead I see the gains broadening out with small and mid caps taking charge.

Remember that the Russell 2000 small cap index is still about 15% under its all time highs. Compare that to the idea that small caps outperform large caps over the long haul. Meaning its time for some reversion to the mean and these deserving stocks getting more investor attention.

What To Do Next?

Discover my current portfolio of 3 hand picked stocks packed to the brim with the outperforming benefits found in our POWR Ratings model.

Plus I have added 4 ETFs that are all in sectors well positioned to outpace the market in the weeks and months ahead.

This is all based on my 43 years of investing experience seeing bull markets…bear markets…and everything between.

If you are curious to learn more, and want to see these 7 top picks for today’s market, then please click the link below to get started now.

Steve Reitmeister’s Trading Plan & Top Picks >

Wishing you a world of investment success!

Steve Reitmeister… but everyone calls me Reity (pronounced “Righty”)
CEO, StockNews.com & Editor, Reitmeister Total Return


SPY shares were trading at $451.30 per share on Friday morning, up $2.46 (+0.55%). Year-to-date, SPY has gained 18.90%, versus a % rise in the benchmark S&P 500 index during the same period.


About the Author

Steve is better known to the StockNews audience as “Reity”. Not only is he the CEO of the firm, but he also shares his 40 years of investment experience in the Reitmeister Total Return portfolio. Learn more about Reity’s background, along with links to his most recent articles and stock picks.