VIX Warns Of Imminent Market Correction

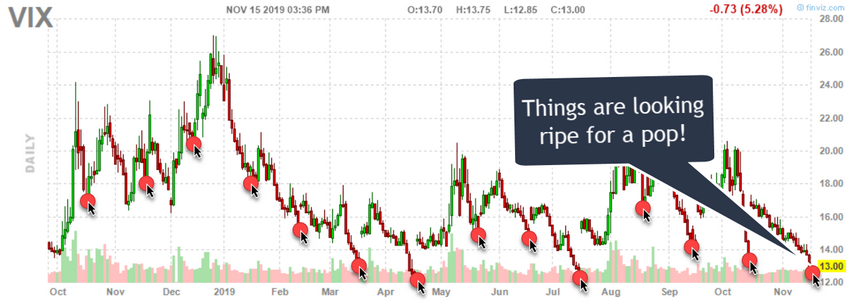
The VIX is warning that a market peak may be setting up in the global markets and that investors should be cautious of the extremely low price in the VIX. These extremely low prices in the VIX are typically followed by some type of increased volatility in the markets.

The US Federal Reserve continues to push an easy money policy and has recently begun acquiring more dept allowing a deeper move towards a Quantitative Easing stance. This move, along with investor confidence in the US markets, has prompted early warning signs that the market has reached near extreme levels/peaks.

VIX Value Drops Before Monthly Experation

When the VIX falls to levels below 12~13, this typically very low level is usually associated with an extreme peak in price. Throughout history, after the VIX has collapsed to these types of low price levels, the markets have a tendency to revert/correct in ranges that are typically in excess of 3.5% to 5.5%. In some cases, these corrections have been as large as 11% to 18% or more.

VIX
Continue reading "VIX Warns Of Imminent Market Correction"

Run Your Portfolio Like A Hedge Fund Manager

As I was perusing my morning news feed, I came across an appalling amount of headlines about the ever-dreaded 'correction.' While there is value in some of these articles, the majority provide no unique insight.

Here's how one should think about a possible correction: How do I spot a correction? How do I protect against losing my shirt in a downturn? And how do I properly implement any suggested strategy?

First Question: How does one even know if a correction is coming? Continue reading "Run Your Portfolio Like A Hedge Fund Manager"

Charts Point To Another 5%-7% Advance Before A Correction

By: John Kosar of Street Authority

All major U.S. indices were higher last week, led by the previously downtrodden Nasdaq 100 (+2.5%) and Russell 2000 (+2.1%). Both of these market-leading indices must continue to outperform the broad market SP 500 if last week's strength is going to become the next leg higher within the larger 2013 stock market advance. The major indices are now all in positive territory for 2014 except for the small-cap Russell 2000, which ended last week down 3.2% for the year.

From a sector standpoint, my own asset flow-based metric shows the largest inflow of investor assets over the past week went into consumer discretionary, which led all sectors with a 2.1% gain. The utilities sector had the biggest outflow of investor assets and, as would be expected, was the only sector to lose ground for the week.

Is Technology Leading the Blue-Chip Stocks Higher?
Beginning in the April 21 Market Outlook, and again in several subsequent issues, I have been discussing overhead resistance at 3,617 on the Nasdaq 100 and stating that a rise above this level was necessary to indicate that this market-leading technology index's larger November 2012 advance was resuming.

After negotiating this level for the past month, 3,617 was significantly broken to the upside last week. This clears the way for more near-term strength and a potential 2% rise to retest the 3,738 early March high.

More recently, in the May 12 and May 19 Market Outlooks, I identified an emerging pattern in the SPDR Dow Jones Industrial Average (NYSE:DIA), commonly known as the "Diamonds." The formation was a triangle, indicating investor indecision, and I said, "For the bullish implications of the pattern to remain valid, the lower boundary at $163 must contain DIA on the downside this week while it rises back above $165.51 -- and stays there." Continue reading "Charts Point To Another 5%-7% Advance Before A Correction"

Friday Poll: Has the market topped out?

With the market at all-time highs, is it ripe for a correction? What are your thoughts? Will we have a correction or will it keep moving higher?

Please leave a comment with your prediction of where you think the DOW, S&P 500 and NASDAQ will end the year.

Has the market topped out?

View Results

Loading ... Loading ...

Have a great weekend,
Jeremy