
 MarketClub is known for our “Trade Triangle” technology. However, if you have used other technical analysis indicators previously, you can use a combination of the studies and other techniques in conjunction with the “Trade Triangles” to further confirm trends.
Elliott Wave Theory categorizes price movement in terms of predictable waves. Beginning in the late 1920s, R.N. Elliott developed his own concept of price waves and their predictive qualities. In Elliott theory, waves moving with the trend are called impulse waves, while waves moving against it are called corrective waves.
Impulse saves are broken down into five primary price movements, while correction waves are broken down into three. An impulse wave is always followed by a correction wave, so any complete wave cycle will contain eight distinct price movements. Breaking down the primary waves of the impulse/correction wave cycle into subwaves produces a wave count of 34 (21 from the impulse wave plus 13 from teh correction wave), producting more Fibonacci numbers.
Elliott analysis can be applied to time frames as short as 15 minutes or as long as decades, with smaller waves functioning as subwaves of larger waves, which are in turn subwaves of still larger formations. By analyzing price charts and maintaining wave counts, you can determine price objectives and reversal points.
A key element of Elliott analysis is defining the wave context you are in: Are you presently in an impulse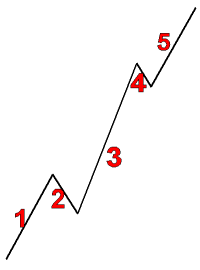 wave uptrend, or is it just eh correction wave of a larger downtrend? The larger the time frame you analyze, the larger the trend or wave you find yourself in. Because waves are almost never straightforward, but are instead composed of numerous subwaves and minor aberrations, clearly defining waves (especially correction waves) is as much an art as any other kind of chart analysis.
Fibonacci ratios play a conspicuous role in establishing price objectives in Elliott theory. In an impulse wave, the three principal waves moving in the direction of a trend are separated by two smaller waves moving against the trend. Elliotticians often forecast the tops or bottoms of the upcoming waves by multiplying previous waves by a Fibonacci ratio. For example, to estimate a price objective for wave III, multiply wave I by the Fibonacci ratio of 1.618 and add it to the bottom of wave II for a price target. Fibonacci numbers are also evident in the time it takes for price patterns to develop and cycles to complete.
Roland,
Thank you for your feedback. That's a good idea I'll pass it along to our technical team.
All the best,
Adam
Why don't you guys incorporate this into the charting software you have? Just makes sense no?
Pretty pithy there, Simon. As The Wizard of Oz observed, intellect is overrated - what the Scarecrow REALLY needed was a diploma to show people.
Well Dr Franke, on a blog it would be better not publish your qualifications. We are all acutely awear of the chaos generated by highly qualified numbsculls who were given the key to the safe and let loose. Maths is merely a model. It does not completely represent reality at any time. Sometimes it is very useful other times it is worse than useless. When it comes to markets it is pretty much useless except for establishing trends on various time scales.
Chartists in general and consequently EW analysts all fall victim to the same error. Prices of equities etc. are necessarily depicted over time
BUT the price of a particular stock or whatever is NOT a function of time. Nobody buys stocks of say IBM because it is Monday, 9:37 am.
Elliot waves are the response of a system to an input the input being the same type of variable as the output, the system response. Thus EW is
based on a function that has itself as argument.Iow the price is a function of the preceding function value. That is EWs cannot have a begin in the finite. Further EWs do not and cannot have a "width" which is measured in time. So given that EW assumes the system correctly it can predict the next move but not its value and not "when" the move happens. It cannot predict its value because EWs are "self-similar".
This is the maths. Factually then most of EW is empirical. But there is no empirical finding of a time constant of the system market.
There are more trade-offs. EW must assume a number of activators (bulls) and inhibitors (bears). However what if there are only a very
small number say investment banks who act equipped with more liquidity than the rest of the market?
Then the basic assumptions of EW theory are invalid.
I think it is better to learn to think as for ex. Goldman thinks.
Dr.H.D.Franke Germany
Succinct and well-put, Lindsay. This is pretty much my approach, along with a certain amount of pattern analysis.
To complete my thought, the current pullback would end at $1,100 (give or take) before prices advance again. I am certainly not putting any money on this. Just observing.
Thanks, Lindsay
If you consider weekly spot gold prices, they (lately) do seem to follow a somewhat regular pattern. If you apply the Fibonacci tool to the top of each multi-week advance (to the top of the wick on the uppermost candle), and draw it down to the low of the previous pullback, the subsequent retreat comes very close to the 61% retracement level before prices advance again. Whether is useful in a wider context, I have no clue, and ... of course... "past success is no guarantee of future performance."
:-o)
you never seize to amaxe me with all your educative lectures .. i am very proud of you ... straight from AFRICA RAZAQ