 MarketClub is known for our “Trade Triangle” technology. However, if you have used other technical analysis indicators previously, you can use a combination of the studies and other techniques in conjunction with the “Trade Triangles” to further confirm trends.
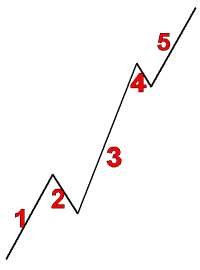
Elliott Wave Theory categorizes price movement in terms of predictable waves. Beginning in the late 1920s, R.N. Elliott developed his own concept of price waves and their predictive qualities. In Elliott theory, waves moving with the trend are called impulse waves, while waves moving against it are called corrective waves.
Impulse saves are broken down into five primary price movements, while correction waves are broken down into three. An impulse wave is always followed by a correction wave, so any complete wave cycle will contain eight distinct price movements. Breaking down the primary waves of the impulse/correction wave cycle into subwaves produces a wave count of 34 (21 from the impulse wave plus 13 from teh correction wave), producting more Fibonacci numbers.
Elliott analysis can be applied to time frames as short as 15 minutes or as long as decades, with smaller waves functioning as subwaves of larger waves, which are in turn subwaves of still larger formations. By analyzing price charts and maintaining wave counts, you can determine price objectives and reversal points.
A key element of Elliott analysis is defining the wave context you are in: Are you presently in an impulse wave uptrend, or is it just eh correction wave of a larger downtrend? The larger the time frame you analyze, the larger the trend or wave you find yourself in. Because waves are almost never straightforward, but are instead composed of numerous subwaves and minor aberrations, clearly defining waves (especially correction waves) is as much an art as any other kind of chart analysis.
Fibonacci ratios play a conspicuous role in establishing price objectives in Elliott theory. In an impulse wave, the three principal waves moving in the direction of a trend are separated by two smaller waves moving against the trend. Elliotticians often forecast the tops or bottoms of the upcoming waves by multiplying previous waves by a Fibonacci ratio. For example, to estimate a price objective for wave III, multiply wave I by the Fibonacci ratio of 1.618 and add it to the bottom of wave II for a price target. Fibonacci numbers are also evident in the time it takes for price patterns to develop and cycles to complete.
 By: Chris Irvin, Veteran Instructor & Trader at The Wizard


 MarketClub
 wave uptrend, or is it just eh correction wave of a larger downtrend? The larger the time frame you analyze, the larger the trend or wave you find yourself in. Because waves are almost never straightforward, but are instead composed of numerous subwaves and minor aberrations, clearly defining waves (especially correction waves) is as much an art as any other kind of chart analysis.