
Today I'd like to welcome back Mark McRae from SureFireTradingChallenge.com. I personally have known Mark for over three years, with Adam knowing Mark well over 5, and Adam and I both agree that Mark is truly an innovator and one of the hardest working traders we know. His latest project, SureFireTradingChallenge.com, kept him holed up with charts and traders from all around the world to find some of the best methods in the world for trading. Check it out here.
Now his blog post today is more applicable now then it ever has been...support and resistance! Let me let Mark teach you a bit more:
=================================================================
Where exactly are the support and resistance points?
Where exactly are the swing points on a chart?
This is a particularly important lesson!
Just about every system or method of trading at least takes note of where the key support and resistance levels are.
I have found a double use for my method of identifying these points - They are also Swing Points!
You may think you know where Support and Resistance is, but do you really?
How do you know where support and resistance really is?
The problem with Support and Resistance (S&R) is that it is not a definite number. It is not an exact point on the chart at which price will, without any hesitation stop.
In fact S&R is actually an area - it is not an exact number as we would all like to think.
The dilemma of course, is that in order to do our calculations we need an exact point. You can't enter $50.10/20 area when using fibonacci or working out your stops and limits. You need an exact number even though S&R is not an exact number.
Try telling your broker that you want a stop loss at somewhere between 50 and 55 and watch him burst a blood vessel.
This is what I want to concentrate on in this lesson. This is a technique I have found to be particularly good at not only identifying strong S&R points but also swing points.
In order to find S&R we must first identify market swing points. There are various ways of doing this but I am going to use the one I have used for years.
For the purpose of swing points we are not interested in the open or close of the bars only the high and low.
Take any bar and think of that bar as the start bar (S). If there are two consecutive higher highs than the bar you marked (S) then that is a swing up e.g. bar (1) has a higher high than bar (S) and bar (2) has a higher high than bar (1). If there are not two higher highs than bar (S) then you move to the next bar and see if there are two consecutive higher highs.
This can be particularly useful if the market is trading sideways and you are trying to determine the breakout point. There may be many peaks and valleys but for me there is only one real point - that is the most recent swing up or swing down.
Look at the next diagram
You can see that although there were a few highs and lows that you could have taken as support or resistance, but it wasn't until bar (M) that a definite swing point had been identified and you could mark bar (K) with an (S).
Swing Down
To work out the swing down point - take any bar on a chart and think of that bar as your start point - bar (S). If the next two consecutive bars make lower lows than the previous bar then that is a swing down e.g. bar (1) has a lower low than bar (S) and bar (2) has a lower low then bar (1). If there are not two consecutive lower lows then it is not a swing point and you move to the next bar.
Just as in the example above you can see exactly the same thing with the swing down. Even though price made a few highs and lows it wasn't until bar (M) that you could mark bar (K) as the (S) point.
Support And Resistance
Only once we have clearly marker swing points can we go on to identify our support and resistance points.
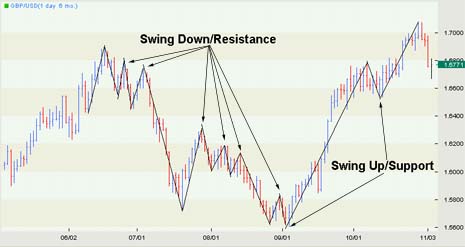
As you can see from the chart I have marked all the swing up points and swing down points. When we are in a down trend then the swing down points act as resistance and when we are in an up trend the swing up points
act as support.
Marking the support and resistance points using this method of first identifying the swing points will give you definite points on a chart from which to calculate your stops, limits and projections.
Good Trading
Best Regards
Mark McRae
==================================================================
Please take some time to visit Mark and see his new project: SureFireTradingChallenge.com.
de ce nu:)
you did not mention how accurate this is. Have you tested this to see how often it does work and how often it doesn't work? Even flipping a coin you still have a 50/50 win or loss chance!
thanks Mark,
but according to this rule we can find to consecutive swing high or swing low ..is that true?
Tj - That is a very important point about zones. It's
like asking an oil tanker to stop within millimeters of
a target. It might stop within inches and it will stop,
but trying to get an exact number will just frustrate
you.
Thanks Wanita
Krishna - most of the time it because someone is not
reading the market correctly. They are only looking at
one time frame and not looking at the next time frame
up. Remember the higher the time frame the more
significant. Also, if S/R breaks that is also
telling you something. Think of supply and demand. When
the market is moving up to previous resistance you know
there is supply there because previously there were so
many sellers that resistance held. Is there still
supply there? Are there still a lot of sellers?
Peter - I don't want to get to advanced here but think
of this. Imagine you have S/R at the same place there is
a Pivot Point or a Fib retracement or stochastic just
turned or MACD just turned and at the same time you
have an inside bar. It doesn't matter what but there is
a confluence of things at the S/R level. That's when
it's worth taking a shot when all the evidence points
to S/R holding. If you have confluence of a lot of
thing at the same place and S/R breaks. Then you
probably have a strong move which you should be on.
The stop should be above/below the "S" point by a few
point/pips/ticks
rc - It looks like that but if you were to trade it
then it would suddenly look different. It needs to be
included with a method or systems. This is actually a
version of W.D. Gann and his trading systems (he used
three higher highs not two). The markets have changed
so much from his day. They are much faster now.
Hope that helps guys. Thanks for taking an interest in
the article and the questions.
Mark McRae
Oddly enough, after the third bar the chart reverses. If one had bought on the third bar in most instances they would have been holding declining issues.
Great post Mark!
Now, here are my 64K$ question (for uptrends):
1) WHEN do you buy (for S-1-2)?
A) The day after the swing up (2), above it?
B) Anytime the day after we have identify the swing up?
C) In-between 1 and 2?
2) WHERE do you put the stop?
A) On the low of the 3rd bar (2)?
B) On the low of the 2nd bar (1)?
C) On the low of the 1st bar (S)?
Much thanks to clarify this!
Peter
Thanks Mark for explaining so clearly the otherwise tedious task of understanding support and resistance points on a chart. I'll be grateful to you, if you kindly also tell under what situations the S and R points fail to produce results expected of them.
Thanks Mark, as always you have a great way of making the lights go on!
Happy Trading
Wanita
You have presented the most clear-cut methodolgy of identifying swing points that I have read.
From my viewing of various videos,these support/resistance lines seemed to magically appear and it seems to me that the teachers know where these lines were just by eye-bally the chart.
Thanks also for correcting my concept of support/resistence existing as definite lines. Now, I know they are zones, not lines.
TJ
Thanks for that Mark
Jimmi, you can use any chart from any market and any
time frame. I don't like to go under 30 minutes
though. It becomes a bit fiddly.
Good luck with the Gold chart Nathan
Thanks Brian. Appreciate the feedback
Thanks, Mark. Every little insight we can get will help give us the edge, and this is a good one.
Thank you. This helps. Trying to figure out the gold chart right now.
Does it matter which chart you look at - should you look at a daily, monthly or 6 month chart to determine where the swing points are.
Awesome. I am a fairly new trader and now I clearly understood what swings point are and how to find them.
Thanks for the info
Mark