
Last week I invited Mark McRae from SureFireTradingChallenge.com, to come and break down support and resistance..and did he ever! Check it out HERE if you missed it. After the post went live we received a ton of feedback with regard to the post AND Mark's project, SureFireTradingChallenge.com, and all the feedback was positive!
So I wanted to give you the chance to learn from Mark again. This time I asked him to go into the Parabolic SAR and the trading system that goes with it. Adam is a HUGE fan of the SAR, as you know, and I think this post will help you see why Adam and Mark both use it. Don't forget to swing by SureFireTradingChallenge.com and give Mark your feedback there.
======================================================================
This particular technique has been around a long time and is still widely used by many analysts because of its adaptability to most markets.
History
The parabolic time/price system was first introduced by J. Welles Wilder Jr. in his book 'New Concepts In Technical Trading Systems'. It is very often referred to as the SAR system meaning stop and reverse. This means when a stop is hit the system reverses so it is permanently in the market.
The actual point at which the system is reversed is calculated on a daily basis (or whatever time period you are looking at) and the stop moved to create a new reverse point. The SAR point never backs up.
In other words if you are long the market the SAR point will increase every day. The same is true for short positions. This is the time part of the system.
The other important part of the system is the speed at which the SAR point moves. If the market is moving fast the SAR point will move slowly at first and then increase as the market moves higher, this is the price part of the system. The rate at which the system increases is called the acceleration factor.
It is beyond this lesson to give the exact calculation of the acceleration factor and it is not really necessary to know the formula as most charting services now incorporate the system in their indicator range.
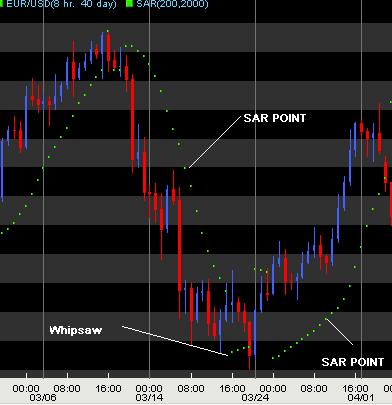
Example of what SAR looks like.
My Use Of SAR
So far so good. The system is simple to trade and is very visual so it's easy to know when you should be short or long. If the SAR point (dots) are above the market you should be short and if they are below the market you should be long.
Here's the problem! It doesn't perform very well in the markets I have tested it on nor do I know any traders who trade it as a stand-alone system. Maybe in the markets of the past it would have worked well but not so now. The problem is there is just too much whipsaw.
Now you may be asking if there is too much whipsaw why mention the system at all? Good question and here are two reasons I find a good use for the system.
* The system can be very effective if a filter of some sort is used. In the example below of the eur/jpy I have used a MACD as a filter. If we were long the market then only long signals would be taken and the short signals ignored as long as the filter (MACD in this case) remains long. If a short signal is triggered but the filter still remains long you could close the position and wait for the next long signal. The reverse is true for short positions. You could use any oscillator you feel comfortable with or even trend lines.

* Sometimes it can be very difficult to find a good place to put your stop. With the SAR system you will always know exactly where to place a stop and it will increase everyday to help lock in profits. It also gives the move enough room for market corrections without taking you out of the position. I like this particular method if I have a long-term position which; I only want to check on once a day. I can quickly check how the position is and then move my stop accordingly.
I am sure you can find many other uses for the SAR system and its well worth playing around with the parameters to see if it can be added to your trading arsenal.
Good Trading
Mark McRae
==================================================================
Be sure and visit SureFireTradingChallenge.com to learn more about Mark and the contest!
Adam,
What would be most helpful in your real teaching would be five minute videos on say FIVE securities : namely SPX, DOW 30, NAS 100 Indexes and any TWO stocks/commodities which you have dealt personally while giving the reasons 'why' and 'what' filters indicated the actions you took, just as you did for GOLD. The reasonaing IS most important! Nothing complicated about that.
My request is that simple and I feel sure your subscribers will be delighted. If such was done in the past I do not know, but could refer to it. If not, it could be accomplished. This is what I would call Blackboard teaching, no 'ifs' and 'buts' about it.
Regards,
Bill N.
Bill,
I apologize to getting to this post so late but to be honest with you we have been very, very, busy here at INO.com and also with our MarketClub site. You may have noticed some big improvements to MarketClub but we expect to announce any day a huge improvement to a service. Stay tuned for this announcement
I will keep doing what I'm doing. I have given numerous examples of our approach to the markets everything from a commodities to stocks to precious metals. Our approach does not change and we expect that the markets you mentioned you can easily replicate using our Trade Triangle technology.
Best regards to you.
Adam
.......there are some very interesting ways of trading the SAR using the first dot info and the candle before it, so much so that my UK data feed has now completely changed the way it displays the SAR on the graphs to make it extremely difficult to interpret the traditional way . If you want to see SAR in action try it on a tick chart and just say what you see.....it all falls into place
Adam,
You are falling short in your response.
I want to know exactly which filters to use confirming a trend once the triangle hits CALL/PUT on any security.
In your action for Gold what exactly did you do and which "filteres" confirmed your decision??
You see Adam : Generalities in your videos are NOT a perfact trading tool while a trader has to try it out with real money. Also, you do not offer a practice account to try out the theory and practice.
The way I see it : Your TUTORIALS should be to show
one-on-one a real trade that you would do while both are on the same screen/phone. That is direct teaching and once having got the hang of it, it is easier to follow the rest of your videos. This is the crux of teacing and your daily updates becoms the main menue which is what subscribers pay for!
Does your team have time for that?? I doubt it.It's quite easy and takes about 10 minutes giving the "whys" and "whatfors" of what your actions.
Regards,
Bill N.
Bill N.
Bill,
This is not my posting.
We are very clear as to our rules. I recommend that you call our office and have one of my customer support team explain our approach.
Here's our number 800.538.7424.
Thanks
Adam
ron - Thanks Ron.
Barry - Exactly on the dot. Whatever reading the dot
has is your stop.
henson - Use the dot. The idea of the Stop and revers
(SAR) is that the dot gets closer to the market as the
market changes direction.
Irishpitbull - Thanks buddy
kyxysyx - Exactly. Parabolic SAR is not a stand alone
system. You need a filer to use it.
Thanks for the questions Guys
Regards
Mark McRae
'The system can be very effective if a filter of some sort is used.'
I use SAR simply as another piece of data to make any decisions.
Sign up with SFTS and work several plans at once!!
Peace!!
I have seen quite a few of your videos. Say, Gold and silver are in an uptrend. Taking an example of Gold : It was $995 yesterday and today $969 and before that $1005. I have watched this with interest and had I made an entry long at $995 I would be down, but for how long and (how much) for it to resume it’s original trend again?
So, how do I take advantage of this short term move against the uptrend and what chart reading would indicate to me of these minor fluctuations and with which supporting filters while holding my long position? Would this also oblige me to became a short term trader glued to internet??
So my question is :should i buy gold ?
Regards,
Paras58,
Thank you for your feedback. While the main trend in the gold remains positive the short-term outlook is negative. This was demonstrated with our trade triangles yesterday when they flashed an exit signal at the 970 level.
It remains to be seen how long the countertrend will remaining in effect for gold. For myself I am waiting for a signal from our daily trade triangles to get back on the long side.
Every success in the markets.
Adam
Bill,
Thank you for your feedback.
The buy signal on gold using out Trade Triangle system came in at 918.2 on 2/11.
We exited that trade today at 970 for a gain of $51.80. That was all because we filter our trades.
Hope this helps.
Adam
Adam/The team,
I have seen quite a few of your videos. Say, Gold and silver are in an uptrend. Taking an example of Gold : It was $995 yesterday and today $969 and before that $1005. I have watched this with interest and had I made an entry long at $995 I would be down, but for how long and (how much) for it to resume it's original trend again?
So, how do I take advantage of this short term move against the uptrend and what chart reading would indicate to me of these minor fluctuations and with which supporting filters while holding my long position? Would this also oblige me to became a short term trader glued to internet??
So my question is : What should I read in the charts and which filters to use for these fluctuations to take advantage thereof?
Regards,
Bill N.
Another great tool
Thanks for the 'heads up' Brad on using the Parabolic SAR system. Just for clarification,should one use the last swing low as a point to place a stop or use the last dot which may be pretty close to the action?
I like seeing support and resistance on the SAR and intend to peruse it.
Thanks again.
Most interesting, especially combined with MACD. One question. You write:
"Sometimes it can be very difficult to find a good place to put your stop. With the SAR system you will always know exactly where to place a stop..."
Well? Are you saying that a stop-loss should always be placed directly ON the dotted lines? Or a few ticks above/below the dotted lines? Or...what?
Thanks for the informative article! barry
Hello Brad: I have often found writings on this particular indicator overly complex and mostly confusing. Thanks for the clear and concise note on the Parabolic SAR .