
BY TRANG HO
INVESTOR'S BUSINESS DAILY
Posted 3/9/2009
Now that the Dow and S&P 500 have blown through their 2002 bear-market lows and regressed to levels not seen since 1996, technical analysts are revising their targets downward.
Based on Fibonacci and Elliott Wave theory analysis, the next level of chart support for the S&P 500 would be 640, according to Mark Arbeter, chief technical strategist at Standard & Poor's. That's down 5.40% from Monday's close of 676.53.
If the S&P 500 breaks below 600, Arbeter sees the next support level at 557, or down another 17.67%. That level also meets up with an uptrend line connecting the 1932 bear market low to the troughs from 1942, 1974 and 1982.
Although chart support levels show areas of significant buying in the past, and the uptrend line has served as a floor for the past 77 years, Arbeter says the behavior in this market differs from other bears.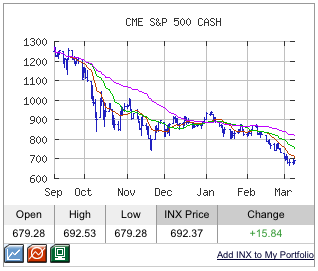
"We're not seeing enough fear in the options market. We haven't seen a big increase in the put-call ratio nor a spike higher in the volatility indexes," Arbeter said. "Until we start seeing more fear in the options market, we won't get to the low."
Unlike in the past, the market appears to be a lagging indicator rather than a leading one.
"It's not properly discounting the bad news that keeps coming out," Arbeter added. "All the surprises over the last year have been downside surprises. The fundamental community continues to play catch-up on the downside."
Downside Of Dow
The Dow closed Monday at 6547.05, down 53.89% from its all-time peak of 14,198 on Oct. 12, 2007. The next target for the Dow is 6000, down 8.37% from Monday's close, says Louise Yamada, managing director at Louise Yamada Technical Research Advisors.
Her secondary target is 4000. She sees the S&P falling to 400-600. It could take a week, a month, a year or more to reach the target.
"Our up/down and volume momentum indicators have been oversold since May, which suggests there's still selling pressure coming into the market even when there are rallies," Yamada said. "The market is suffering from deleveraging of 30 to 40 times leverage that took place over the past few years."
The bottoming process between 2002 and 2003 took at least a year, during which technical indicators improved. But there are no signs of such improvement now, Yamada says.
Today's stock market is commonly referred to as the worst since the Great Depression. If the 1930s bear market — in which the Dow plunged 89% — serves as a road map, we're halfway to the light at the end of the tunnel. That bear market lasted 34 months from peak to trough. This bear is in its 17th month.
The market's recent action suggests hope has waned that government stimulus plans will keep this bear market from being as bad or lasting as long as the 1930s bear.
Uptick Rule Consequences
In fact, some government action may be making it worse. Eliminating the uptick rule for short selling on July 6, 2007, has sent the market tumbling harder than in the past, argues Adam Hewison, co-founder of Marketclub.com.
The uptick rule for short selling, established by the SEC in 1934, required that every short sale be entered at a price higher than that of the previous trade. It aimed to prevent short sellers, who make money when stocks fall, from adding to the downward pressure of a falling stock. "With the uptick rule, (short sellers) couldn't pummel companies as quickly," Hewison said.
He projects the Dow will fall to 5000, down 23.63% from Monday's close. He sees the Nasdaq composite at 1000, down 21.18%. He expects the S&P 500 to fall to 500, down 26.09%.
Hewison's long view: The market will sputter sideways until the next super bull cycle starts sometime between 2018 and 2020. "This isn't going to be the V-shaped turnaround that everyone thought it was going to be," he said.
---
See Original Post Here: http://www.investors.com/editorial/IBDArticles.asp?artsec=28&issue=20090309
Investors Business Daily
from a trading point of view - I see the divergences on the daily chart and will have a go to the upside with a target around 750 in SPM9 (.382 Fibo level) - tight stops a must since the downtrend is still in force
Yet another blogger who can accurately predict the future 1, 5, and even 10 years out but can't tell you what the market will do tomorrow. It's getting a little old. It's getting real old.
Son, I can tell you that without certain healthy maintenance done on certain schedules, the highway from here to the beach will crumble in certain general areas but I cannot tell you exactly where the next crack will appear. I'm sure you have your own analogies. It seems about the nature of the universe, pretty much. We can see less the closer we get to something. Most things. What you seek would be a complete contradiction in the nature of things. If ANYONE could predict what the market is going to do tomorrow, IT WOULD NOT BE A MARKET. By it's very nature it would probably tuck itself up inside itself and disappear like that dude on Yellow Submarine. Tucked his head up his butt and -- bloop! -- plum disappeared. That's what the market might do if one could predict its action the next day. That's MY prediction, anyway.
what a great analogy!
IDIOT ITS PEOPLE LIKE U THAT DESTROY US
Pocono,
Thank you for your feedback. At MarketClub we do our very best for our members. You may not agree with what we say but we certainly don't say that lightly or to provoke market action.
Take a look at what we said on November 21st of 2008. Here's the link
http://club.ino.com/trading/index.php?s=6600+on+the+dow
At that time the Dow was trading at 7552 and we were right the DOW did drop to the 6600 level that we were using as a target zone. We had nothing to do with pushing the market down, nobody is bigger than the market.
The target zones that were published in IBD and on this blog still stand. We believe this is what's going to happen. If the market changes direction we will change with it. Technical analysis is an art and not a science.
In the next 12 months if in fact the S&P 500 does go to 500 which way would you want to be in the market?
These are trading markets and not long-term investment markets any more. The world has changed and you either have to change with it or you'll be left behind.
This is my opinion, whether I'm right or wrong it is what I see right now in the marketplace.
All the best,
Adam
its easy to go backwards! we have never faced what is going on now. any predictions from the past as far as im concerned is done after the fact!
IDIOT---PROVOKE SOME MORE FEAR
Charting is a basis of predicting price movements and although it can be deadly accurate, its not perfect. It only percieves what the market MAY do, thus it only makes sense that these forecats are merely projections of where the market will head, based on the info the analyists uses.
So based on that, I imagine that both the above forecasters will be "somewhere" in the right area. We wont actually see the bottom until well after the event so only time will tell. But at least they aren't predicting the stupid calls other people are forecasting of major rallies ahead. I mean on what basis can anyone call a rosy future for this market?
This is a MAJOR event in anyones lifetime and I can't inmagine its going to end in a V shape and take off again. I'm with Adam here, its 10-15 years of hard slog ahead.
Peter,
Thank you taking the time to add your comment.
Much appreciated.
Adam
The contrarion approach is one to be taken but at the outset, Feb. 2007.
You would have been wrong till Oct 2007.
The mkt is going down till 5,500/3,500 on the Dow is reached and 550/350 on th S&P 500 is reached on the EMINI FUTURES..NOT CASH INDEX.
In Feb. 2007, I knew the ES was going down to 1177 and YM to 10725. Then when this was reached- 1177 and 10725- and breached, I knew it was going to 550/350 and 5,500/3,500. It's coming for sure.
The mkt may go up till April mid 2009 then crash to these other numbers by July 09. The low this year 2009 or in 2011 could/will be 1-2,000 on the YM and 150-250 on the ES. These are the real low targets. What ever the low targets in 2009 they will be retested in 2011.
The Buy and hold crowd has been toast and will be toast. Greater fool theory which is what the stock mkt is based on "Paper"...toilet paper, unlike tangible commodities, which, will never go to ZERO.
Money is in commodities in 2010-2015/16. Money is always in commodities but the parabolic runs will return. The stock mkt will be range trading as interest rates will go up in 2013/2014 to combat inflation and cause a mild recession in 2016.
Then 2016 we start the bull like 1982 but faster as globalization and more participants will make the move up faster. 2016 will see the ES back to 1586.75 or lower and YM to 14267 or lower, will know the number by July 09.
I really should be running a billion dollar fund!!!
market tradionally goes down in may abit
The idea that the uptick rule has any significant long-term effect on stock prices is the biggest canard since buy and hold investing. The idea that an uptick should be required before a short sale is just as ridiculus as requiring a down tick before any shares can be bought. This is simply an artificial barrier to efficent price discovery, which is what the market is all about.
In a world where options, futures and other derivative instruments are readily available for trading at far greater leverage any reasonably sophisticated trader can do the same thing outside the primary market. The big difference : you're making the marketmakers rich by paying the spread in both directions. These are the people who are begging for the uptick rule to come back and want spreads on stocks to go back to a nickel or more. Wise up folks. When there's no buyers to be found it's the short sellers who create the initial demand for an upward move by covering their positions.
As a trader there shouldn't one bit of differnce between going long or short.
Mike,
They're considering bringing back the uptick rule in the April meeting so it should be interesting to see what happens.
Your right there are lots of derivatives out there, some of the problems I have with derivatives are they have to lay off there bets in the futures markets. The futures markets are small and used to be for a bona fide hedgers and speculative traders. The third entity into this fray are the ETF's. The ETFs are masquerading as stocks when basically they are massive hedge funds who are laying off their bets in the futures and options markets. As an individual trader you can only trade so many futures contracts in certain markets. As a hedger you basically can create unlimited amounts of futures contracts. This causes an imbalance and skews the deck to once was a very level and balanced playing field.
I believe somewhere down the line they're going to reevaluate the ETF markets, but that's in the future and I'm not sure how that will play out.
We have an excellent blog on this by a guest blogger who made a very strong case on how ETFs skewed the investments scene.
Here is the link. Decide for yourself.
http://club.ino.com/trading/2008/06/traders-are-commodity-etfs-fueling-the-energy-spike/
All the best,
Adam
Hurry everyone w/ a soapbox get out the word so we can have mass traders go w/ this and sink the market. Get on CNBC and preach more armeggeddon! If everyone says it, we can gurantee it will happen.
its actually a positive that analsts keep saying where going lower and picking lower numbers because the bottom is always reached before analst targets are met leaving the majority of people left out of the most sugnificant part of the up move in the beginning.