
BY TRANG HO
INVESTOR'S BUSINESS DAILY
Posted 3/9/2009
Now that the Dow and S&P 500 have blown through their 2002 bear-market lows and regressed to levels not seen since 1996, technical analysts are revising their targets downward.
Based on Fibonacci and Elliott Wave theory analysis, the next level of chart support for the S&P 500 would be 640, according to Mark Arbeter, chief technical strategist at Standard & Poor's. That's down 5.40% from Monday's close of 676.53.
If the S&P 500 breaks below 600, Arbeter sees the next support level at 557, or down another 17.67%. That level also meets up with an uptrend line connecting the 1932 bear market low to the troughs from 1942, 1974 and 1982.
Although chart support levels show areas of significant buying in the past, and the uptrend line has served as a floor for the past 77 years, Arbeter says the behavior in this market differs from other bears.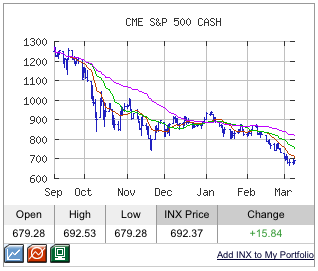
"We're not seeing enough fear in the options market. We haven't seen a big increase in the put-call ratio nor a spike higher in the volatility indexes," Arbeter said. "Until we start seeing more fear in the options market, we won't get to the low."
Unlike in the past, the market appears to be a lagging indicator rather than a leading one.
"It's not properly discounting the bad news that keeps coming out," Arbeter added. "All the surprises over the last year have been downside surprises. The fundamental community continues to play catch-up on the downside."
Downside Of Dow
The Dow closed Monday at 6547.05, down 53.89% from its all-time peak of 14,198 on Oct. 12, 2007. The next target for the Dow is 6000, down 8.37% from Monday's close, says Louise Yamada, managing director at Louise Yamada Technical Research Advisors.
Her secondary target is 4000. She sees the S&P falling to 400-600. It could take a week, a month, a year or more to reach the target.
"Our up/down and volume momentum indicators have been oversold since May, which suggests there's still selling pressure coming into the market even when there are rallies," Yamada said. "The market is suffering from deleveraging of 30 to 40 times leverage that took place over the past few years."
The bottoming process between 2002 and 2003 took at least a year, during which technical indicators improved. But there are no signs of such improvement now, Yamada says.
Today's stock market is commonly referred to as the worst since the Great Depression. If the 1930s bear market — in which the Dow plunged 89% — serves as a road map, we're halfway to the light at the end of the tunnel. That bear market lasted 34 months from peak to trough. This bear is in its 17th month.
The market's recent action suggests hope has waned that government stimulus plans will keep this bear market from being as bad or lasting as long as the 1930s bear.
Uptick Rule Consequences
In fact, some government action may be making it worse. Eliminating the uptick rule for short selling on July 6, 2007, has sent the market tumbling harder than in the past, argues Adam Hewison, co-founder of Marketclub.com.
The uptick rule for short selling, established by the SEC in 1934, required that every short sale be entered at a price higher than that of the previous trade. It aimed to prevent short sellers, who make money when stocks fall, from adding to the downward pressure of a falling stock. "With the uptick rule, (short sellers) couldn't pummel companies as quickly," Hewison said.
He projects the Dow will fall to 5000, down 23.63% from Monday's close. He sees the Nasdaq composite at 1000, down 21.18%. He expects the S&P 500 to fall to 500, down 26.09%.
Hewison's long view: The market will sputter sideways until the next super bull cycle starts sometime between 2018 and 2020. "This isn't going to be the V-shaped turnaround that everyone thought it was going to be," he said.
---
See Original Post Here: http://www.investors.com/editorial/IBDArticles.asp?artsec=28&issue=20090309
Investors Business Daily