
Even though there are hundreds of indicators out there, people still can't find one (or a few) that fit their trading style and methodology. I've been a fan of Greg Fisher from Median-Line-Study.com, and his work for a while now. Today I've asked him to teach us a little more about the Median Line AKA Andrews' Pitchfork. Please leave him some comments with your thoughts and questions!
====================================================================
Imagine having the ability to draw a single line - the Median Line - on any stock, forex, or futures price chart, and know there is a high probability prices will reach that line. That is exactly what the late Dr. Alan H. Andrews proposed in his “Action/Reaction Course” in technical analysis of the markets in the 1960’s and 1970’s.
The method is more commonly known today as Andrews' pitchfork. However, as I have learned from several of the students that took Andrews' course - he hated the term pitchfork!
Andrews stated in his course:
“…drawing a single line will enable you to know where the price of any stock or any future is now headed and the probable time it will reach there.”
And, the Median Line method would,
“…enable the user to be one of the few who can tell where the prices are headed, and the place they will reach about 80% of the time, and when approximately that place will be reached.”
Andrews definitely thought in terms of probability. In fact, in the chart-filled 60-page original course, the word “probability” shows up about 40 times!
Line studies such as the Median Line can serve as LEADING indicators of potential price direction. They have a PREDICTIVE nature. Most other indicators are LAGGING indicators. They RESPOND to price action AFTER the fact.
The Median Line often serves as a magnet to price. When price gets near the Median Line, it often does one of three things:
1.) Price reverses,
2.) Price accelerates,
3.) Price consolidates.
The Median Line also often serves as a barrier to price and holds similar characteristics to horizontal support and resistance lines. However, there are significant advantages the Median Line holds over standard horizontal support and resistance lines. The main reason is the Median Line is often drawn at a slope and therefore:
1.) Gives an indication of the direction of the trend in addition to providing a “support/resistance” line,
2.) Adds a “time” factor,
3.) Presents a mathematical relationship (probability) of price reaching it.
Horizontal support/resistance lines offer a potential “place” where price will find support/resistance. Median Lines not only offer a “place” where price will potentially find support/resistance, but a “time” as well.
This reiterates the idea introduced earlier by Andrews’ statements at the beginning of the article - "where" and "when" price will reach the Median Line.
How do you draw the Median Line?
The beauty of the method is its simplicity. To draw Andrews’ Median Line, first identify three consecutive, alternative pivots on a price chart. Pivots are extreme prices on a chart where a change in trend takes place. The pivots used to create the Median Line follows the sequence: high, low, high or a low, high, low.
To draw the Median Line:
STEP 1. Label the pivots in sequence P0, P1, P2
STEP 2. Find and mark the midpoint of line P1-P2
STEP 3. Draw a line from P0 through the midpoint between P1 and P2 and extend the line.
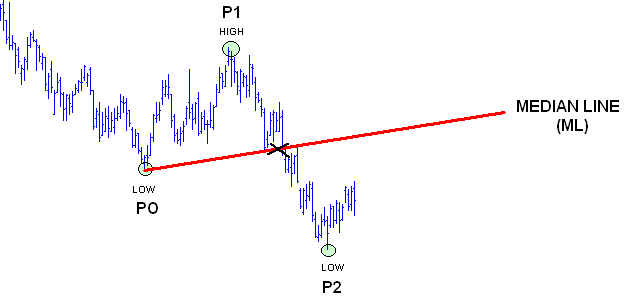
That's it! You have drawn a Median Line.
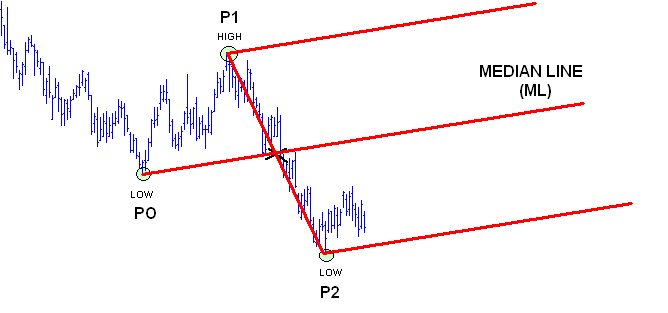
To finish the Median line set (or Andrews' pitchfork); draw a line parallel to the Median Line at P1 and another at P2. The two outer lines are the Median Line parallels. Price often finds support/resistance at these lines.
Andrews also set out five basic rules concerning the Median Line and its parallels in his original course,
"There is a high probability that:
1. Prices will reach the latest ML,
2. Prices will either reverse on meeting the ML or gap through it,
3. When prices pass through the ML, they will pull back to it,
4. When prices reverse before reaching the ML, leaving a “space”, they will move more in the opposite direction than when prices were rising toward the ML,
5. Prices reverse at any ML or extension of a prior ML."
When I found the Median Line method over five years ago, I wondered, "Does a method developed almost 100 years ago still apply to today’s markets?" "Does the claim Dr. Andrews' made that price returns to the Median Line 80% of the time hold true?"
I decided to test the claims and set up a study of the five basic rules. I wrote, "Using Median Lines as a Trading Tool: An Empirical Study - Grain Markets 1990-2005" for an independent study course on my way to getting an MBA. What did I find? The most interesting result I found was that the "80% rule" was right on the mark. I also found some high probability repeating patterns as price cycled within the Median Line set.
There are numerous trading systems and methods out there. I encourage you to test each method thoroughly and prove to yourself the truth behind the claims. And most importantly - don't discount the simple, time-tested, and "old-fashioned" methods of technical analysis like the Median Line method. You may be surprised with the results!
Regards,
Greg Fisher
Median-Line-Study.com
I am amazed to see the many videos on you tube that mention the Andrews and Babson Lines. Some evn have a bit of an understanding of the techniques. A while back I posted a youtube video with my friend Dr. Alan Andrews live at his last seminar. If you would like to get some reliable info on the techniques, it is probably a good idea to contact someone who studied with Alan Andrews ( and can prove it ). There is a lot of good information out there on the lines. One of my best articles was published by Tradersworld magazine on Babson lines. Traders Journal, based in Singapore showed how to find tops and bottoms in July of 2007 and the S&P showed us the same pattern a few months later at the top in October.
Some give away the "62 page course" For a richer and deeper understanding go to youtube and search for Alan Andrews treasure. You will see there is a lot more to it and with the detailed explanation in the many charts he sent out you can get there.
Ron Jaenisch
Andrewscourse.com
If you are interested in trading, one of the first hurdles you will have to overcome is to determine what kind of system to use in order to decide when to enter and exit your trades. In your initial research, you will find an abundance of online resources that will either help you find your way, or get you lost on a winding road full of distractions. If you are not careful, you could end up spending a lot of money and time purchasing and learning to use indicators, subscribing to ineffective systems and getting scammed by claims of instant fortune. As a ten year market veteran, who has been exactly where you are, I urge you to examine Dr. Alan Andrew's market techniques.
In the early 1960's, Dr. Andrews released a home study course for traders. The course was based upon Isaac Newton's "Action/Reaction" law. Newton's law states that every action has an equal and opposite reaction. This law can be applied to many areas of life and Dr. Andrews, with the help of a trusted ally, Roger Babson found that it was especially helpful in determining the direction that a stock or commodity might take in reaction to a particular action. Roger Babson applied Newton's law to his trading beginning in the 1920's and touted it as the reason he amassed over $50,000,000.
The most renowned piece of Dr. Andrews teachings was a simple to use, accurate means of determining areas of support and resistance known as the "Andrew's Pitchfork".
The basics of the theory require the user to determine three points on a chart which, when connected bear an uncanny resemblance to a pitchfork used by farmers. A middle, or "Median Line" could sometimes be used as an indicator of price trend. The upper and lower lines on the fork, represent areas of support and resistance as well as points of potential profit taking.
Many indicators are valuable assets when looking for trade setups. Some are even as effective as the Andrew's Pitchfork, but none have been as eternal. The market is constantly changing and adapting and eventually finds a way to render most indicators ineffective. What it cannot do, is outsmart Newton and Andrews. Every action, does indeed have, and will always have and equal and opposite reaction.
Before you get swallowed in by expensive systems full of short term promises designed to take your money, do some research. Look carefully into the works of Dr. Andrews and let the Median Lines guide you.
MedianLineTrading.com
Thank you, Greg, and also Adam, for sharing the concept of using Median Lines with us. I will apply it to my next trading practice.
Cathy
Can we have ALL other filters explained similarly?
You have done a good job.
Bill N.
Terrific explaination Mr. Fisher. I am running Genisis Trade Navigator Charts and use the Andrew's Pitchfork with success on both 120 and 240 minute charts in the forex. Thanks for posting this article.
In case of low, high low, should P2 be lower than P0? or could P2 be at the same level of P0?
In case of high, low, high, should P2 be higher than P0? or could P2 be at the same level of P0?
Can we apply the ML to double tops (letter M) or to double bottoms (letter W)?
Please advise and thank you very much Greg for your very interesting info.
Nazir,
1.) Low-High-Low - Yes, the P2 can be at the same level as P0. The P0-P2 line would then also be a horizontal support level.
2.) High-Low-High - Yes, the P2 can be at the same level as P0. The P0-P2 line would be a horizontal resistance level in this case.
The Median Line can be very effective at these double tops or double bottoms as it provides a target for price after it bounces off the support or resistance line.
Thank you Greg for your response, but still I'd like to know the following:
In case of low – high - low, can P2 be higher than P0?
In case of high – low - high, can P2 be lower than P0?
Please advise.
Nazir,
Low - high - Low - Yes, P2 can be higher than P0.
High - low - high - Yes, P2 can be lower than P0.
The author wrote "I decided to test the claims and set up a study of the five basic rules. I wrote, “Using Median Lines as a Trading Tool: An Empirical Study - Grain Markets 1990-2005″ for an independent study course on my way to getting an MBA. What did I find? The most interesting result I found was that the “80% rule” was right on the mark."
How was this tested? What exactly was the probability that the 80% rule was right? What was the P value? Was the analysis done in a blinded fashion? Was it checked by independent non-biased individuals? What was the N of the experiment?
It is very very easy to throw around terms, and I see nothing here to provide any confidence that this author knows anything about probability or statistics. Why should we just believe what is written without some proof? Where is the evidence for this so-called "high probability"? At least you should provide a reference for his independent study course or any other of his tests of this analyses so we can check out for ourselves how he did his statistics to prove his conclusion of "high probability".
This comment proves the probability of 3.85+% walk around with
glasses half empty.
Thank you for your article. I would be interested in reading your paper on the grain markets. Is it available?
I did not see a mention on the time factor. How do you determine when price will return to the median?
Looks to me like a rendition of the simple 1-2-3 Strategy sans Bollinger Bands. What do you think.
Had never thought of Pitchfork in this light, but giving more emphasis to the median line has some similarities to Market Profile. Will try this in Forex.
Exceedingly well written. Superior content. Will visit your URL to see what else you do.
Please blog again!
David
Isn't there a similarity between this and using Bollinger Bands with
a midpoint plotted? Offhand the price action that Andrews describes
between high and low and the median line would seem to regularly occur
with Bollinger Bands and a plotted midpoint too.
Interesting article. Definitely agree that this median concept is a helpful tool. I call it Proportionality or Symetrical Behavior of the price advance/decline which has assisted my trades on intraday plots since March. I suspect ( have not researched) that this symetry may become distorted below the median on a down day (i.e. Larger pattern) and likewise on the up side on a strong up day. And that distortion is not a problem because it is expected when one side has more conviction.
I would also suspect that a Linear Regression Line performs similarly and that tool is found frequently on trading software.
Appreciate your article . Perhaps you might comment re whether these all amount to essentially the same tool or do you see nuances between them?
Again, whatever term is used, I have found it works very well for me on intraday charts.
Ron
So your telling us that upon reaching this line, it will either go UP, DOWN or SIDEWAYS?
WOW, now thats a totaly new concept
Can you apply this to a major index such as S&P 500.
Thank you
Eric,
Absolutely! Median Lines can be drawn on any price chart.
In fact, Dr. Andrews shows examples in his original course of how he forecasted daily temperatures using Median Lines.
Have you compared this system to using the Fibonacci Retracements?
Interesting article, I'm going to learn more about it and it's application. Thanks for sharing it!
Dave
I have worked some with geometric retracements? There are many Median Line traders that use them along with Median Lines, because they are leading indicators as well.
Very interesting, thanks. Can you explain further item 4- When prices reverse before reaching the ML, leaving a "space"..... ?
Thanks again.
Sure, Brad.
Andrews was referring to a "price failure" where price failed to reach the Median Line - which he determined was only about 20% of the time.
For example in the graphics above, if price failed to reach the Median Line in its current move up from P2, the "price failure" rule would suggest that it would drop below the price level at P2.
Price was "suppose to" go to the Median Line, but since it fell short, the expectation would be a further drop below where the upward move started.
Greg
Is there a way to write an automatic method for preparing a medium line and associated lines?
Preferably in TC200 by Worden.
A lot of charting software on the market has Andrews Pitchfork as one of the drawing tools. I am not familiar with TC200 by Worden.
Most software with the tool require you to manually choose the three pivot points and the ML set is drawn for you.
Greg
Hi,
Interesting article. I am new to this so my question may sound silly.
Can you use the Median Line for any time frame?
Thanks
Nick
Nick,
Yes the Median Line can be used on any time frame. Most of the work I have done has been on daily charts. Dr. Andrews' used weekly and even monthly charts in his original course.
More recently, many traders have adapted Median Lines to intraday trading - for example using 20-min charts in the currencies. Some even use them on 5-minute charts in a variety of markets.
Yes nick you can use it on time frames where there is sufficient volume. A visual way to tell is looking at the 5 min spy charts ...they are ok. Then take a look at 5 min alg charts. Those are ones that you probably would not want to trade.
All the best
Ron
andrewscourse channel on youtube.