
Joining us today is John Bougearel, author of the renowned book Riding the Storm Out. Enjoy as Jon states his case for why the third quarter high may already be in place. As always be sure to comment and let us know your thoughts.
===========================================================================
The problem with being perpetually short is the need to be willing to be perpetually chased out of the market for an untold number of short-covering rallies. This strategy works well for nimble traders that have a great feel for market behavior. The reason I start this report off with the saying “if you’re not short already is that you will indeed risk missing the turn. We got a lot of ground to cover, here, so let’s start with the big picture on the weekly charts, then move right into the daily and intraday charts.
Don’t Mess with Mr. 18

The bearish momentum on the 18 month moving average is sloping into 1020 this week. This extremely active moving average is aggressively bearish as we end the 3rd Quarter of 2009, sustaining a trade above it for any length of time on the initial challenge as we head into October is almost laughable. The last time the SP500 challenged this moving average was May 2008, not a pretty result, given how our policymakers made missteps throughout the balance of the year by not implementing mechanisms to successfully resolve future Bear Stearns failure events. Choosing to make the entire financial system a government-sponsored zombie can hardly be said to be a laudable policy choice for the long term. There may be very little virtue in these short term policies being implemented for the long term, but hey, it is what it is. But I digress, the point is that, at the very least, one must be hedged or rebalancing one’s portfolio if long up to this point. The market is encountering the stiff headwinds of the bearishly sloped 18 month moving average. Be safe. Get protection and enjoy the game.
The identified resistance zone a month ago was 1028-1052. This is half way back to the Oct 2007 high and a 58% advance off the March 2009 low. The rally to 1048 last week fell just shy of the 58% advance target. The 58% advance target was the inverse of the 58% decline into March 2009. The high set last week. You will want to note that Sept 11 2009 is the same day of the month that set the high in October 2007, the 11th.
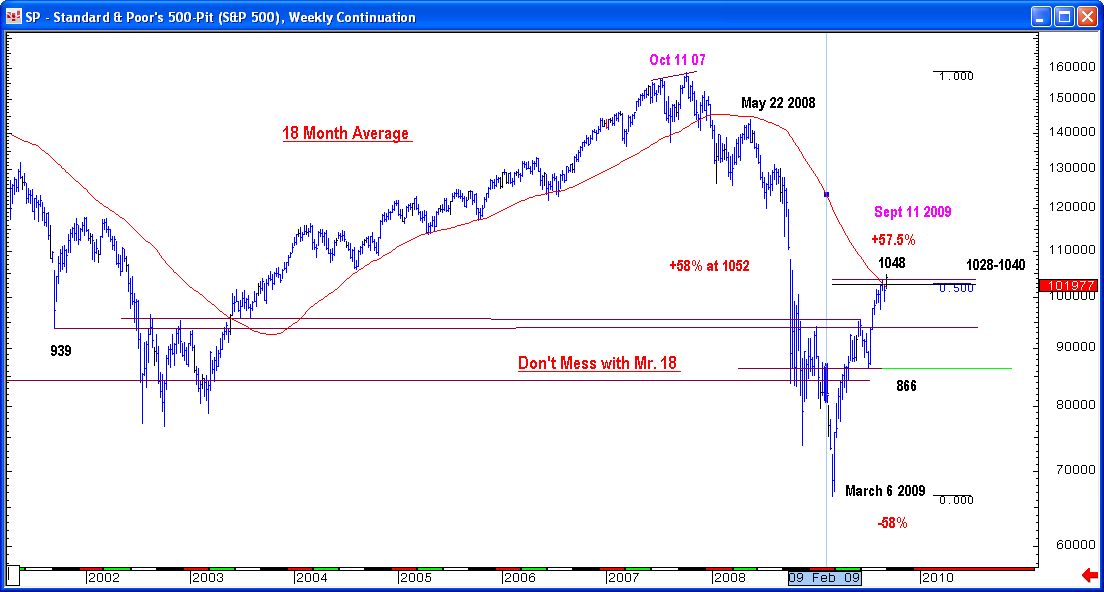
We can not neglect to point out that the last time fiscal and monetary stimulus was this strong happened to be in 1975, when tax cuts and fiscal spending quadrupled the federal deficit. The initial rally off the December 1974 low stalled out after a 55% advance 7 months later. This is quite approximate to the 58% six month advance off the March 2009 low.

A ten-week 12% correction ensued following the 55% initial advance in 1975. I expect the correction to follow will be a minimum of 9-12% targeting 922-952. This would include a retest of the 9-11 lows at 939, the 1998 lows at 929-936, and as we can see on the daily chart below, a test of the Q1 and Q2 2009 highs at 943 and 957 respectively.
Where We are on the Three Peaks and Domed House on the Daily Chart
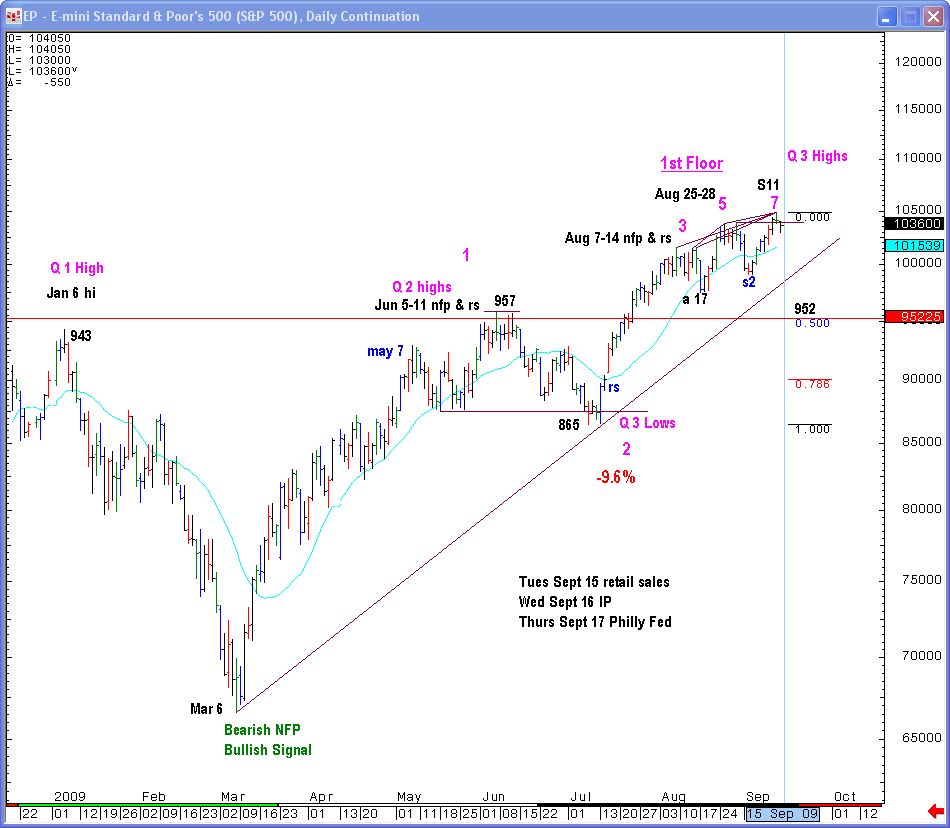
The chart above indicates the SP500 has put in the point 7 high on the Three Peaks and a Domed House pattern, or nearly so. The pattern indicates that a point 10 low is apt to form shortly. The signature attribute about point 10s in this pattern is that they are sharp and sudden. They are volatile and can be deep corrections. It is NOT a surprise when these sharp breaks occur. Roughly speaking, we want to bracket that 50% retrace to the July Q3 lows at 952 as the first key support. 952 falls smack dab between the Q1 high at 943 and Q2 high at 957. It is near here that we should expect market participants to begin slip into their dip-buying modality and dip-buying behavior in Q3 and Q4. That may or may not be “too close to the market.” If volatility really kicks in high gear, we could see a retest of the Q3 lows at 865.
Such an event can not be ruled out ahead of the mid-October economic calendar which includes the October 14 retail sales report for September. This will be one ugly month over month report because the cash for clunkers program ended in August. So, the September retail sales report in mid-October will be particularly ugly. Like a bad kidney stone, until the retail sales report for September has passed, risks to the downside will outweigh the upside risks.
I have insisted for several weeks that until the September 15 retail sales report “has passed” risks would be to the upside. That is to say the govt programs, tax cuts, and boosts to social security have created short-term boosts to retail sales in the summer of 2009. The goosing of the retail sales report has in turn goosed the stock market. The biggest risks to investors occurred after the June 11 retail sales report. Investors bought the rumor, sold the news. The same thing is about to happen again. But investors need to be wary of one fact, the stock market does not need to set a new high on the Sept 15 retail sales report. The high could well have been set on Friday September 11, and investors are now getting positioned short or short-hedged ahead of that report.
I say that investors are getting hedged short ahead of the retail sales report for several reasons. First, most all of the major highs and lows were set on Friday this year. These Friday dates include March 6, June 5, Aug 7 and Aug 28. Now, the August 28 high has a peculiarity that I want to take pains to point out. Investors knew that Tuesday’s Sept 2 ISM report would be friendly, but what did they do. They got hedged short on the Friday before, and the friendly report was treated harshly. Yes, there was some rankling in China about their central bank removing stimulus, but heck, there was no offset from the friendly ISM report, the stock market simply tanked that day. Could a new move high set on Tuesday’s Sept 15 retail sales report and squeeze shorts yet again? Yes, it could, but, then again, if we don’t get a high close today, and closes this Monday low like Monday August 28 closed low, the shorts will be encouraged to stay short into tomorrow’s retail sales report and ride out whatever upside volatility they need to with room to still throw out more short hedges above last weeks highs.
Momentum on the intraday chart has shifted overnight from being outright bullish to being simply neutral to bullish. This happened last in late August and then rolled over. Now, this week happened to open at 1029 on the Dec 09 contract. This is the daily high close of August for the continuation contract. The bullish moving average is sloping into 1031 today. Below 1029, the stock markets short term bullish momentum will roll over and we will begin a full blown market correction into October.
That is why investors and traders will be trying to get short today above the August high on the Dec contract at 1034 and around 1038-1041. They do not know whether there will be a high close or a low close on the SP500 today. Broadly speaking, however, if the short sellers win the day today in the 1034-1041 zone, and do not get chased out with a high close and prices roll over to the downside below 1029 by end of day today, well then it should be curtains for the second advance off the March 2009 bear market cycle low.
The intraday charts:
EP 120
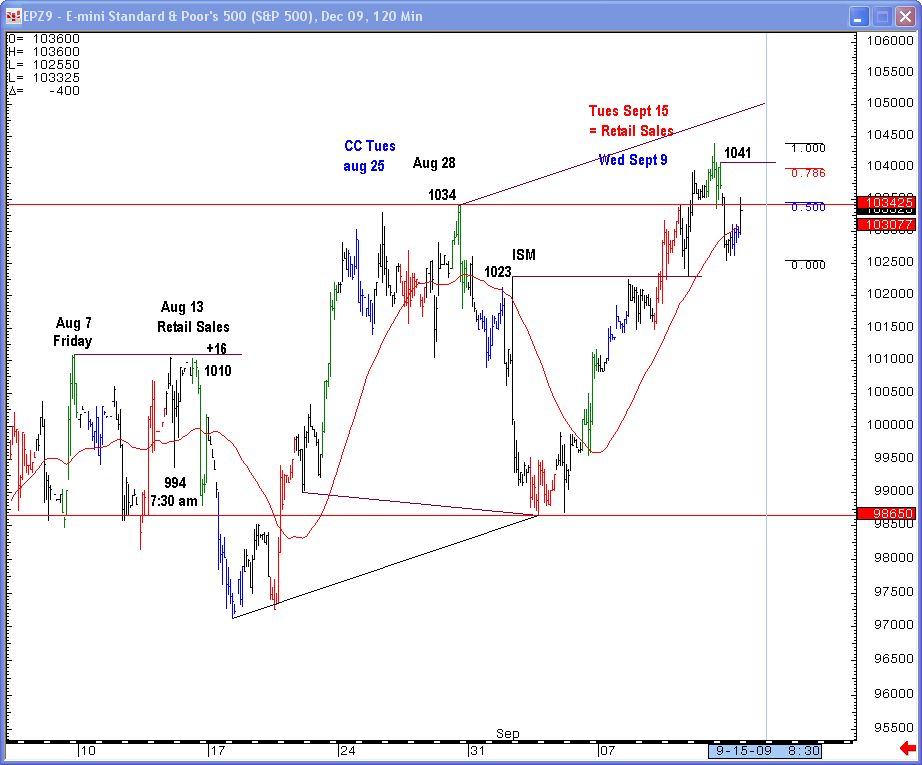
Not only did investors get short ahead of Tuesday Sept 2nd ISM report on the Friday prior, they also got short on Friday August 7 prior to the August 13 retail sales report. By the time the Aug 13 retail sales report came out at 7:30 am, the stock market was too far below the high of Friday August 7 to take it out when the friendly August 13 number came out. Thus the potential for a low close today makes a strong case for traders and investors to be hedging themselves short today in the simple event that when the friendly number comes tomorrow, investors sell the good news because they have already bought the rumor.
Revisiting the Domed Pattern on the Intraday Chart

For the past several weeks, I have focused on the Sept 1 ISM to the Sept 15 Retails Sales report as the time window to expect an intermediate cresting of the stock market. I have also outlined that Lindsay’s Three Peaks and a Domed House pattern on the intraday chart would be cresting in this time window. The “dome” on this pattern are points 21-to-23. As we can see, the time window the dome has crested in has actually been Aug 28 to Sept 11. August 28 was two days before the Sept 1 ISM report and Sept 11 was two days before the Sept 15 retail sales report. Yes, a high close today would likely set up the potential for a spike high on the Sept 15 retail sales report, But, if the stock market “sits down” by end of day today, setting new move highs on the retail sales report will be that much more difficult. Whether a higher high sets tomorrow or whether it set on Friday Sept 11 matters little.
This report allows for a nominal new high to be set on Tuesday’s retail sales report before correcting. This possibility detracts nothing from working premise that the stock market is at its weakest moments after retail sales reports this summer, as seen in both July and August. The conclusion is that the downside risks will far outweigh the upside risks near term after the Sept 15 retail sales report, for roughly one month. In other words, this 58% advance off the March 2009 lows will come to a conclusion as the government’s short term stimulus from cash for clunkers no longer gooses the month over month retail sales reports. The only flaw in this analysis is that my recency bias is not validated by subsequent price action and market behavior. Big whoop, I can live with a small margin of error and adjust. So can you in your own risk management strategies.
Oh, and that intraday domed pattern, btw, is a leading indicator. There are 28 total points to the pattern. The signature attribute to the point 28 low is that it retests the point 10 low, which in this case is the Q3 low at 865 set at the onset of the earnings season when Whitney made her bullish call on the banking sector. Nice call Whitney. A retest of the point 10 low would be to “round-trip” the 3rd quarter. Because this is an intraday count, and not the daily count, I want to seriously caution bearish traders not to overly commit to this 865 target. If it is not reached by October 14’s kidney stone of a retail sales report, let it go. There is a mountain of support bulls can cling to in the 922-952 price zone, and the point 10 low on the daily pattern count, just may not get through it. We just don’t know from here.
It is truly a buyer beware market after the Sept 15 retail sales reports. You don’t want to end up with buyers’ remorse like those one in four cash-for-clunker buyers. Give the market a chance to breathe, allow it to oscillate to the downside for a month, until that Oct 14 kidney stone of a retail sales report “has passed.” I’ll bet my bottom dollar you will be glad you did!
Cheers,
John Bougearel
www.financialfuturesanalysis.com
To receive the follow-up to this post call 1-800-538-7424 or email our service team at su*****@in*.com.
===========================================================================
John is the Director of Futures and Equity Research at Financial Futures Analysis and author of Structural Logic’s Financial Newsletter. John has logged over 13 years of experience across a broad array of exchange-traded financial futures and securities markets.
35 and 90 day moving averages are the key. If not violated, early October should be projected high.
Good Stuff!
Excellent article, whish we had more of this.
I believe this general scenario to be applicable to all indices.
Joe, if you pull up a one year chart for 2003 you'll notice something interesting in mid Sept. that you don't really notice on the multi chart.
John:
I'll take the other side of that trade!
My analysis, showing we are at a similar point to where we were on 6/2003, with confirmation by the monthly MACD and the monthly stochastics can be found here: http://chart.ly/vwhqh9.
This predicts another 600 points higher from here!
--joe
Joe, pull up a one year chart for 2003, you'll see something in mid September that you might not have noticed on the multi year chart. Cheers
Here is my comparison of the 2003 chart and the 2009 chart: http://chart.ly/n66s5e. I see a dip below the 50MA in Sept 2003 that was quickly bought - is that what you mean??
This still looks very bullish to me.
--joe
Yea, I agree it is a very bullish chart overall, I think the author was only pointing out a short term pullback just as you see in the ballpark of Sept 20, 2003. We need to have another pullback here soon, markets are too high and haven't really had a healthy pullback since July. It's overdo IMO. Best of Luck
John,
you are absolutely correct, this is a short term pullback anticipated by pattern analysis. Patterns are leading indicators, in this case a sharp and sudden pullback is indicated by this pattern. Behavioral modeling suggests this pullback will extend into mid-Octobers economic calendar before this cyclical bull market in a secular bear market gets going again.
Hi John, thanks for the reply. I'm with you, my thought process was that the market would continue it's uptend until this week. I also was looking at a pullback to the 950-960 range. This market is just difficult to predict anymore with all the enthusiasm running ramped out there. Any update you want to add since yesterday's article? This can't go on too much longer imo. I think if it does then when it does pullback it will be hard and fast and possibly break through the above mentioned support, hard to tell anymore. Thanks for the reply, warm regards, John.
John,
You and I are very much on the same page. The market should have been expected to be up into this retail sales week. This week includes a lot of bullish economic data from August retail sales on Tuesday, IP on Wednesday and Philly Fed on Thursday. The market will like all these data points. Then the market rolls onto the Dec contract on Thursday. Your market forecasting is working just fine, you just haven't gotten any short term bearish signals yet.
You are also right to anticipate the pullback will be hard and fast. I detail both the bearish signals to look for, plus why the market break should be hard and fast. 950s is a good spot to expect support but so will be the 970s near term. But there is time to allow for an even worse correction.
I wrote an update to clients this afternoon. Email su*****@in*.com for the follow-up report. The bit of difficulty you are having reading the market short term should become clearer to you in the follow up.
thanks
John
John, not sure why my first reply to your latest post didn't take but thanks again. My email to you has been sent to see what your update and thoughts were for the continued uptend and when it might turnover. Thanks for sharing your comments and opinions.
My thought process and chart analysis is different from yours, while I also use ma's, I also look for repeating trading trends and scenarios to repeat themselves until ma's show me otherwise. It's interesting we came up with the same time frame for a pullback. I believe that because this is a traders market we will see earnings season as a cataylst for trading trends. They always have been to some extent but it seems that it might be even more so now in this traders market. I look for a pullback about 2-4 weeks before the next earnings season runup as a general rule then wait for confirmation of the trend to begin. This way I can actually play the downside then the up trend with a fair amount of confidence after confirmation. We'll see how this one plays out, you know how the market is, just when you think you figured out a trend it changes to keep you on your toes.
Thanks sgain for your help, Leon
We have had a ton of requests for Johns follow-up. To receive the follow-up to this post call 1-800-538-7424 or email our service team at su*****@in*.com.
To read more from John visit: http://broadcast.ino.com/redirect/?linkid=971
Best,
Kenny
John:
I'll take the other side of that trade!
Here is my chart analysis, showing we are at a very similar place to where we were on 6/2003 on the 18 month MA, the monthly MACD, and also the stochastics are all confirming this. Chart: http://chart.ly/vwhqh9
--joe
use an 18 month weighted moving average & it looks completly different.
Thanks for your great analysis
thank you you gave me some confidence that I have done the right thing.
I am out of the market until October for sure and maybe until January.
Earl
Earl,
You are most welcome. If you re-read the article, you will find that I am looking for a point 10 low to buy in mid-October. The earnings season should go smoothly in October from cost cutting and July-Aug revenues benefitting from govt programs to induce spending.
Significant new highs are anticipated from a point 10 low in Oct