At MarketClub our mission is to help you become a better trader. Our passion is creating superior trading tools to help you achieve your goals -- no matter which way the markets move -- with objective and unbiased recommendations not available from brokers.
The Trader's Toolbox posts are just another free resource from MarketClub.
---
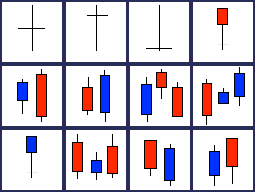
"Japanese candlesticks, which have been enjoying the spotlight in recent years, are difficult to explain in one broad brush. Candlesticks draw on the same open-high-low-close data as do bars. Here the length of the bar, or “candle,” is determined by the high and low, but the area between the open and close is considered the most important.This area, the “body” of the candle, is filled with blue (or white for most charting programs) for closes higher than open, and is filled with red (or black from most charting programs) for down days. The wicks above and below constitute the “shadow” of the candle, or high or low.
No pattern is 100% correct, but these formations are often time incorporated into many mechanical systems and can provide as great information source for the naked eye...."
Revisit the Trader's Toolbox Post: "Candlestick Formations" here.

It's such an significant subject and ignored by lots of people, even pros. I thank you for your help getting people more educated about that topic.
very interested in this technique.dl
Thanks for this short summary of Japanese Candle Stick formation. Always interesting to have some fresh lesson on something that we use often.