
 Consistent, successful trading requires a systematic approach that you are 100% confident in. When talking to today's guest blogger and INO TV author Gary Wagner of "Forex Gold Forecast" a few days ago about recent trades, it amazed me how confident he was in his own technical analysis. I thought it would make a good article for the Trader's Blog so I had him write down a few thoughts on trading and how he has utilized his own system.
-----------------------------------------------------------------------------------------------------------------------------
Effective trading is a science, but it is also an art. Choosing the scientific models (technical indicators) you wish to combine to create your trading methodology requires a journey. A journey over time, through which by trial and error you will arrive at an approach that is successful. You need to assemble a toolbox of technical indicators like an artist assembles brushes. Just as each brush creates a different effect, each technical indicator reveals distinctive information about the market. Knowing which technical brushes to use and when to use them is essential. It will provide the trader with the tools needed to create an effective systematic approach.
Trading is also an art in that there is no single system or approach that defines a successful trading method. As in art, it is the result that defines whether a technique has merit. There are many roads that can lead to profitable trading. Finding the road that is right for you is your journey, mine took me to the study of Eastern technical indicators.
When I first started in 1985 as a commodity broker I was introduced and trained in fundamental and western technical market analysis. In 1990 one of my most profitable clients sent me the book “The Japanese Chart of Charts” by Seiki Shimizu. This book changed my approach to technical trading, and greatly defined my current trading style.
In this book he revealed one of the earliest forms of technical analysis, Japanese candlestick charts and their patterns. The Japanese traders were the first to describe market sentiment mathematically. They were the first traders to explain supply and demand economics and market sentiment as a battle between the bulls (yang) and bears (yin). The outcome of that battle is expressed mathematically as a picture: a single candlestick. Now some twenty years later it is accepted by the western trader as the prevalent charting style. Viewing price data in candlestick format is more visually complete and the more you understand about this technique, the more insight it will reveal to you. Once you have an understanding of candlestick patterns you can use them to identify and effectively pinpoint market reversals as well as trend continuations.
We produce a daily video newsletter for gold traders, the “Forex Gold Forecast tm”. In it we combine Japanese candlestick patterns with western technical analysis to formulate our market commentary. We are trend traders, so the first step is fundamental and technical trend analysis to establish market direction. We apply Japanese candlestick patterns as our primary trigger for buy and sell signals. We use support and resistance analysis for stop loss levels. We use trailing stops to exit profitable trades.
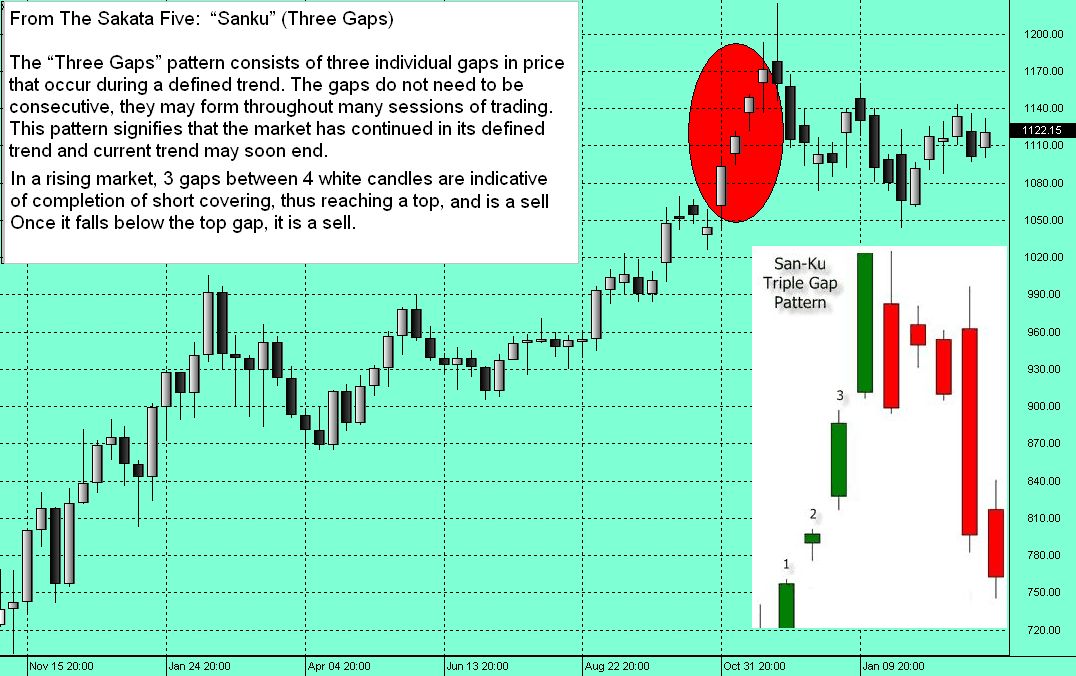
On December 4th 2009, we issued a sell signal in gold. There were many factors visible that directed us to that conclusion. In the weekly Forex gold chart we got our first hint that a sell off was about to occur. A very rare pattern called a “Three Gaps Pattern” was formed. The Japanese call this “San-ku Fumiage”, it represents a price ceiling.
This pattern does not occur very often, and cannot typically occur in a daily Forex chart (there is no opening or closing bell to create a price gap between sessions). In its purest form there is a price void or gap between each of the four candle bodies and wicks (total trading range from high to low). In this example there was a price void between the real bodies (open to close) of each candle. In my research, I have found that since the Japanese technician places such importance on the bodies of the candles that they will view this as a valid example of a “Three Gaps Pattern”. When we first saw this pattern form we believed there was a high probability that the current trend was about to enter a correction or reversal. We than began to look for sell triggers in the daily charts.
Gold trades as a 24 hour market in Forex, with no opening or closing bells (except Fridays close to Sundays open). Comex gold on the other hand has a true open and close. Taking that into account we will look at the Comex gold chart for information. Many times this chart will yield different and revealing candlestick patterns unavailable in the Forex chart. Such was the case on December 4th, 2009. On that day both the Forex and Comex gold charts had sell signals, each issued from completely different candlestick patterns. Both signals were strong bearish reversal signals.
In Forex gold we saw a “Dark Cloud Cover” confirming candle had formed. A bearish confirmation candle is created on the following candle, and is needed to act on most two session candlestick reversal patterns. On a bearish reversal signal one should look for a black candle composed of a lower low, and a lower high.
In the Comex daily gold chart a “Southern Cross” had formed. It was this pattern that we used to recommend the sell signal. The “Southern Cross” is a variation of a “Three River Evening Star”, but with a long legged “Doji” in the center. A “Doji” is a single candle that has an equal open and closing price. We have found this to be a very strong signal, much rarer than the “Dark Cloud Cover”, with a higher probability of success. Below is a daily Forex gold chart, also showing the Comex candle pattern. The combination of signals in the weekly chart and the daily charts were overwhelmingly bearish. We felt it was a very solid call because of the multiple patterns we found.

The work, time and effort needed to create your trading methodology are huge. You are investing much more than just your money. It requires so many hours of study and testing, and initially so many more failures than successes. Because of that, I believe it requires one last component: passion. A Passion for the art and science of trading, this is critical in my opinion. The potential monetary reward will give you the drive, but without a passion for this journey, you will be missing a most important ingredient, the creativity needed to find your unique style of trading.
Gary S. Wagner
-----------------------------------------------------------------------------------------------------------------------------
Gary S. Wagner has been a technical market analyst for twenty five years. He is the Co-author of “Trading Applications of Japanese Candlestick Charting”. A frequent writer for Technical Analysis of Stocks & Commodities magazine, he also Co-developed software applications for market forecasting. He produces a daily video newsletter “The Forex Gold Forecast” for WFGForex.com.
True Gary. TA definitely allows better entry and exit points.
Gold is still in an uptrend. But the current technical formation is like this.
1) 3rd Dec High on April Gold @ 1229 is A High
2) 22nd Dec low on April Gold @ 1076.50 is A Low
3) 11th Jan high on April Gold@ 1166 is A lower High
4) 5th Feb low on April Gold @ 1045.5 is A lower Low
5) 3rd March high @ 1145.8 is A lower lower high
Now we need to break 1045.5 and close below it for at least 5 or 6 trading sessions to confirm a down trend
Interesting. Of course, I don't doubt the correction down to 1045 (where India bought Gold) or perhaps down to 1000. However, fundamentals trump technicals and with Central Banks buying physical, ETFs buying physical, debts exploding across the globe, fiat paper printing band-aids at the de-leveraging, I wouldn't be surprised to see technicals change bullish quicker than we think. The booms have become more debt induced and the busts have been stymied by even more debt. I have never been a gold bug, but things have changed drastically in the last year. Of course, gold is becoming a bit more mainstream with hedge fund buying, but the confirmation that gold is in a much bigger bull market than people think is a couple of dots.... the dollar rallied since early December from 74 to 81 and gold only corrected to $1100. Many days gold rallied with the dollar as the Euro was getting crushed as both became a "flight to safety". In addition, gold saw all time highs in various currencies like the Euro and Sterling. In a point, I have finally seen gold trading as an alternative currency in the last month. I have waited for that signal for a long time.
I heard the saying "Gold is the new currency of choice" last month. It is a powerful statement for gold. The fact that George Soros is doubling his stake in gold shows that some big players are betting this metal now.
As for your statement that "fundamentals trump technicals" ...
As a hard core market technician, I will be the first to acknowledge that it is fundamental news which drives market price. One of my mentors used to teach me that fundamentals are like the captain of the ship, only he knows where he will turn the wheel next. The technician can only study the wake left behind. That being said as a technition I believe patterns in price repeat over time. I think that technical analysis looks to find patterns from the fact. It is the assumptiom that supply – demand economics can be expressed mathematically.
Thankyou for your wise comments and also you have taken actions on yopur belief. I admire that, if you have the experience you claim (no offence intended)I think as a relative newby I will do the same.
Do we dare use the word "fundamental" in this group? I've sold SOME of my gold and miners based on the recommendations here, but not all. The technical indicators mentioned are dark, oh yes, but gold will be back. We must certainly recognize that "what people are buying and selling" and "supply/demand" are also very "fundamental" to the price. Plus, our best insights to Those Fundamentals are what we see in charts and patterns. But I'm not just "trading" gold, nor just following trends. Keep the faith.
It's an interesting area to study... I've found these are good for the day trader, but for the weekend investor, they are often "out of date" by the time he/she gets around to investing. Appreciate your perspective.
The history of candlestick chats and the patterns they create dates back to more than four hundred years. The Japanese trader first used them for the purpose of analyzing the rice markets in the Dojima Exchange. The earliest forms of this method took into account seasonal changes in price. The reason I mention this is that candlestick analysis is not just for the day trader. I have found it can be used for many different types of trading styles.
Adam, you are reading the words of the biggest gold bug that ever lived. I started to buy gold back in the late 90's and it was a big success. I believe that in the next few years gold will be the biggest winner by far. Now in saying that, at the present time I wouldn't touch gold with a 10 foot pole. I believe you are right in your gold comments. I just exited all my gold positions today. It's too bad I didn't go with my gut 2 weeks ago because I would have sold and avoided much pain. You live and you learn I guess. Gold, imo, is about to get hit very hard. But you can bet your last penny I'll be back and be a buyer at lower prices. It's time to be out of stocks and long cash. Good luck trading and thanks for all your hard work.
Great article!! Is the book you mentioned, japanese chart of charts , still
available? or could you recommend any other books on candlestick analysis.?
Thanks
Norm
Yes The book is still available.
other books are:
Steve Nisson has 2 really good books
Japanese Candlestick Charting Techniques, Second Edition by Steve Nison (Hardcover - Oct. 30, 2001)
is the one I would start with
Candlestick Charting Explained: Timeless Techniques for Trading Stocks and Futures by Gregory L. Morris (Paperback - Mar. 27, 2006)
and mine is not too bad either
Trading Applications of Japanese Candlestick Charting (Wiley Finance) by Gary S. Wagner and Bradley L. Matheny (Hardcover - Oct. 1993)
Yes you can still get this book.
I also think you should look at:
Candlestick Charting Explained: Timeless Techniques for Trading Stocks and Futures (Paperback)
~ Gregory Morris (Author) "
Beyond Candlesticks: New Japanese Charting Techniques Revealed (Wiley Finance) (Hardcover)
~ Steve Nison
and mine is not bad either:
Trading Applications of Japanese Candlestick Charting (Wiley Finance) by Gary S. Wagner and Bradley L. Matheny (Hardcover - Oct. 1993)
Very good , i thing we are geting close to buying.What is your opinion?
Tom,
I am also fundamentally bullish on gold, long term. In an article I wrote for Stocks & Commodities magazine in February, I stated I would not be surprised if long term gold prices rise to 1500 an ounce. However, I am a technician and the technical indicators currently point to a bearish price move. Based on Fibonacci retracement I see support at 1077 and 1038. I agree there is a floor for gold prices. The question is what price will you find the floor.
this is total nonsense, what a joke
Nice article, Gary. Thanks.
Informative, yes indeed. I still believe gold has a floor under it. The Chinese (and I) will be buying more if it pretty darn soon.
Tom,
Yes there is a floor in gold, that is what I also think. Where the floor is is the big question.
I think the long term fundamentals in gold are bullish. In the February issue of Stocks & commodities I wrote an article entitled
"Candlesticks and Gold". In this article I said that it would not surprise me to see gold rise long term to 1500.00. However I am a technician by training, and the technical indicators a bearish for gold right now. I see support at 1077 and 1038, based on fibonacci retracement.
Gary... thanks for really interesting and educational article!!!
Russ
Russ,
Thank you for your comment. This is a most interesting time in gold. On last nights video update we spoke about 3 factors leading to a further sell off. First; it had broken below our support line on Sunday. The support line was drawn from the lower line of a pendent or flag formation. When you have a flag formation the range narrows and the break out can have a lot of energy. That will push the market strongly in the direction of the breakout. Second: gold was trading for the third day below the fibonacci retracement level of 50 %. That is a very significant level, once broken can lead the market to the next retracement level. Lastly the double Doji's were signaling a potential break in the market, as the market consolidated. This morning we did see quite a move.