
 Today's guest is Gary Wagner of The Forex Gold Forecast who shared shared part one of his unique triple-play of forex gold analysis in a blog post titled, "A New Technical Triad and Gold". In part 2 of his strategy, Gary explores what is now happening in the gold market and what we might expect before fall.
We hope you enjoys today's post and leave your comments for Gary below.
-------------------------------------------------------------------------------------------------------------------------------------------------------
Where Might Gold Head This Summer
Trading the gold market might look easy when you consider that it has gone up $282 dollars in one year. However anyone involved in gold trading whether it be through Comex, Forex or Eft’s will tell you different. This is part 2 of a blog which began on May 13, 2010 (you can find that post here). In part one we spoke about the relevance of using Elliot wave, Fibonacci retracement and candlestick patterns as 3 tools well suited for market analysis and forecasting gold prices. This part two will continue where we left off. On May 13th we were nearing the top of wave 3 in Forex gold. Since that time we have completed that wave, seeing gold trade to a new historical high of first 1248, then after a correction (wave 4) to a new all time high in wave 5 of 1265.
Part two will explore the possibility that we have now entered the corrective phase in this bullish gold run. Fundamentally bullish on gold, I believe that gold over the next 6 to 8 months will take out the new historical high of 1265, and possibly test 1300 dollars. But before we get there, it is quite plausible that will enter a corrective phase. As outlined in Elliot wave theory this correction would consist of 3 waves: A, B & C. Waves A and C being the corrective (bearish) waves and the B wave being a predominately bullish wave.
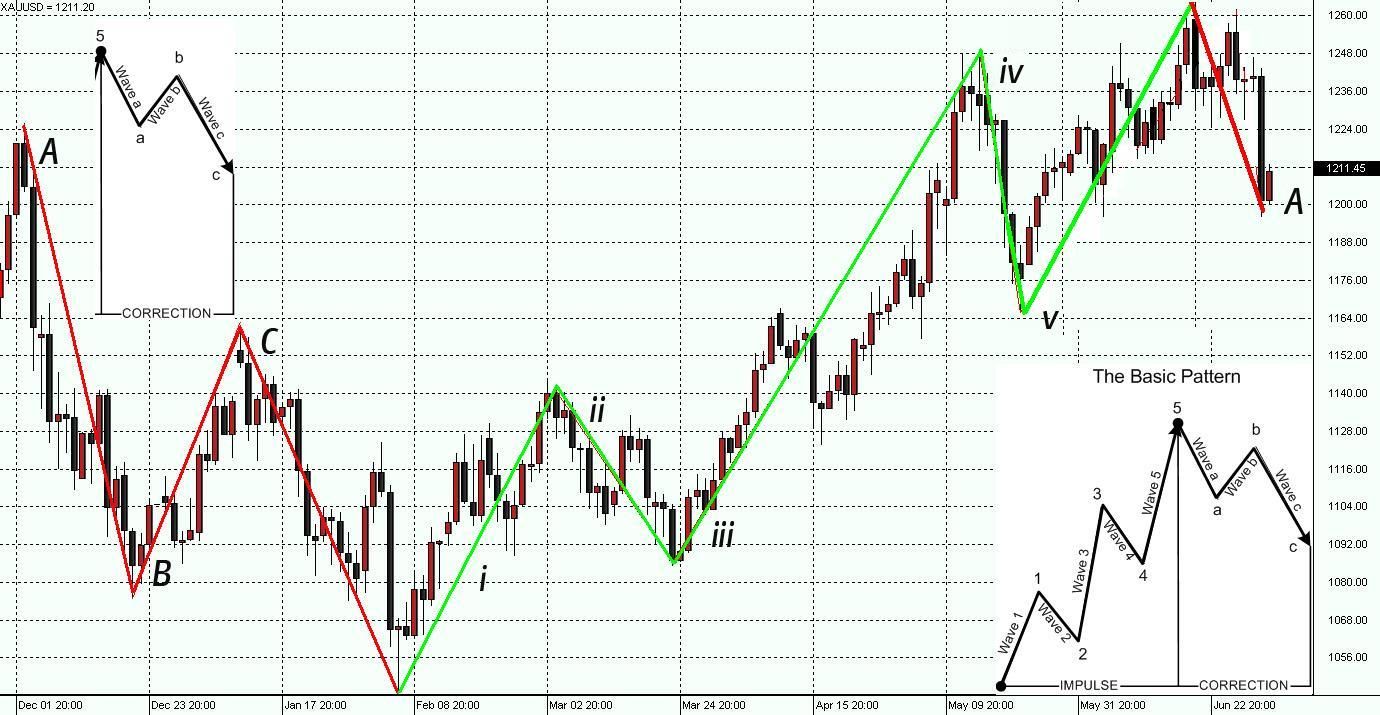
Figure 1 is a daily chart of Forex gold. Starting on the far left you can see the first correction after gold hit a historical high of 1221 in December of 2009. According to Elliot wave theory, a market trend follows a cycle. That cycle is made up of eight waves. This eight wave sequence will repeat until the trend is exhausted. This trend structure is composed of eight waves, divided into 2 phases; the motive phase and the corrective phase. The corrective phase is composed of three waves (A, B and C), they will move opposite the primary trend. Waves A and C will be corrective waves, while the B wave will move in the direction of the primary trend. Here we see the corrective phase, wave C, which took gold to a low of 1045 in February 2010.
Now that the full eight waves were complete, we once again began our motive phase and another bull run in gold. This phase is composed of 5 waves (waves 1 through 5). Waves 1, 3 and 5 will move in the prominent direction of the trend. These 3 waves are called the motive waves. They will be separated by two retracement or corrective waves (waves 2 and 4), where the price action will move against the current trend. From February 2010, until the end of June 2010 we would witness an extraordinary bull move in gold, taking it to a new historical high of 1265. This high would prove to be the top in gold as from there it traded lower, falling under 1200 intraday to a low of 1197.00. This in my opinion began a corrective phase and the start of corrective wave A.
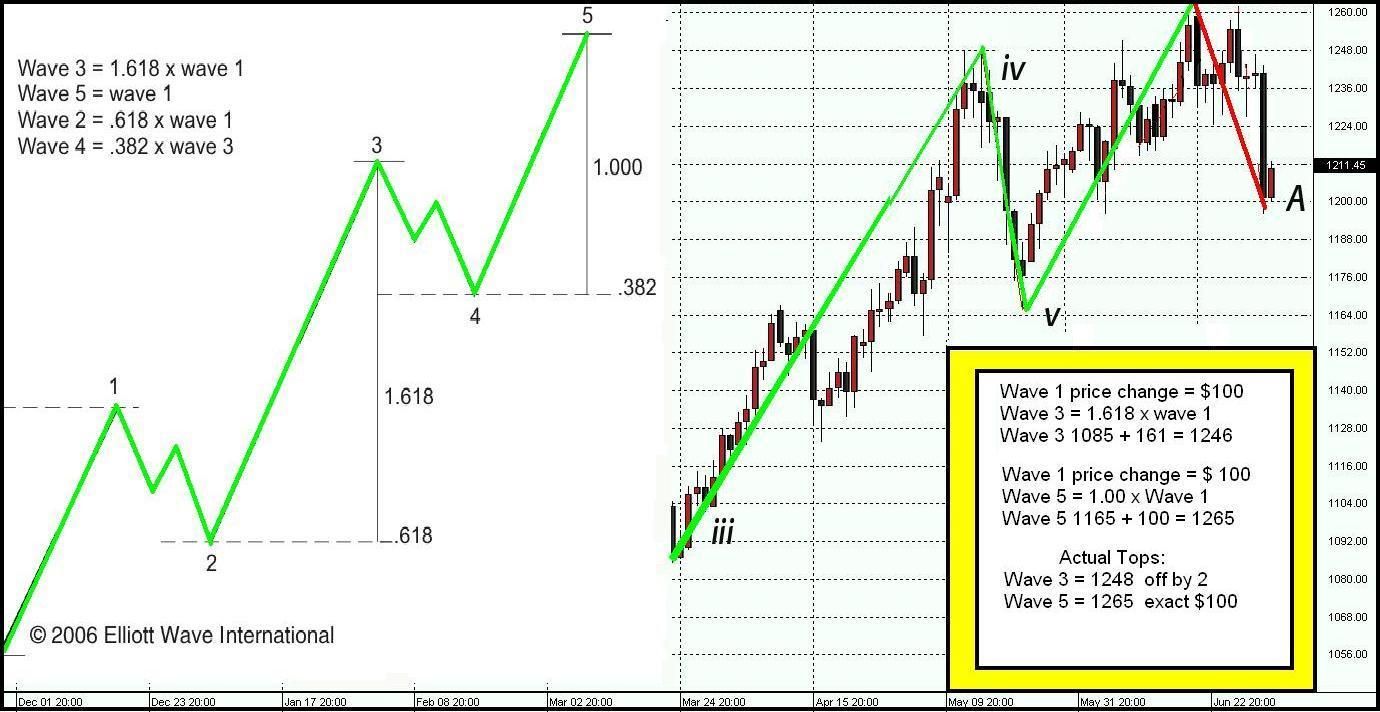
Figure 2 looks at the Elliot wave count starting from wave 3. Using wave 1 as a benchmark and applying the rules of Elliot wave length forecasting, it proved to be very accurate in predicating the tops of both wave 3 and wave 5. In chart 4 from part one of this blog you will see that we were looking for a top to wave 3 at 1246. At the time of that blog Forex gold was trading much below that point. Elliot Wave was able to correctly come within a few dollars of the actual top of 1248.00. By applying these rules to the fifth wave, it proved to be just as accurate as in wave 3. From guidelines set forth by Elliot Wave International, wave 5 can be about equal to wave 1. So adding $100 to the low or start of wave five (1164) gave us a target of 1265.
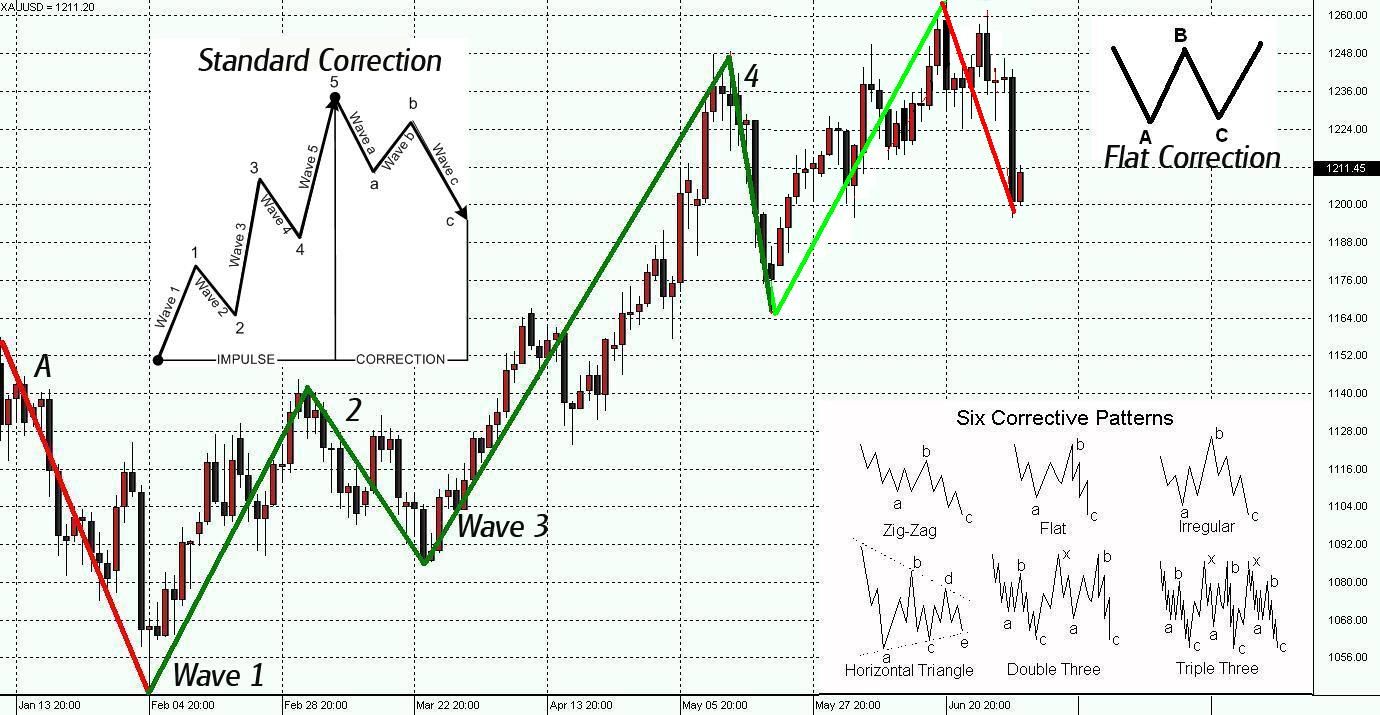
Figure 3 takes us to our current market time line in Forex gold. If and it’s a big if, we have entered a corrective phase where might we see Forex gold trade over the next few months? Typically a corrective phase could last two or three months. Think of the last corrective phase which lasted from December 2009 to the beginning of February 2010. With that in mind if history repeats itself, this corrective phase might take us to September or October of this year.
Although the corrective phase can be realized with six different types of corrective patterns, two of them are the more common occurrences, so that we will look at the possibility of either a standard zig-zag, or a flat correction. For this to be a true correction wave B, cannot trade with a higher high than the fifth wave (1265). In fact if we have truly entered a corrective phase wave B should be about 50 to 75 percent of the move seen in corrective wave A.
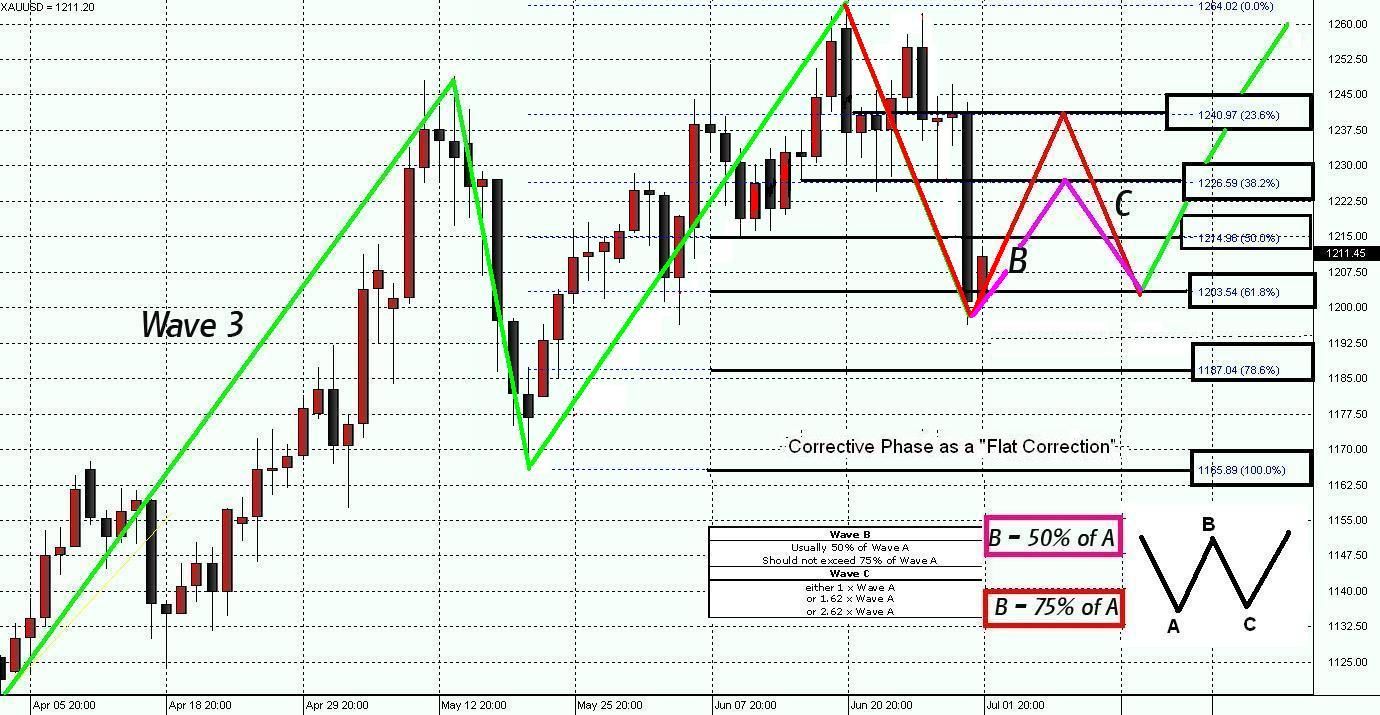
Figure 4 is a daily chart of Forex gold glimpsing at what a flat correction might look like. In a flat correction the low of both the A and C wave are about equal. It forms what looks like the letter “W”. To calculate the possible targets for Waves A, B & C, we use Fibonacci retracement theory. One can look to use standard trend analysis; however I have found Fibonacci retracement theory, to match very well with standard trend lines, and much easier to plot. To Create a Fibonacci number set for the corrective phase I used the high and low of wave five, and thereby created the following target points. 1187 equals a 78% retracement:
- 1203 equals a 61% retracement
- 1214 equals a 50% retracement
- 1226 equals a 38% retracement
- 1241 equals a 23% retracement
If 1203, the 61 % retracement of wave 5 turns out to be the bottom of the first corrective “A” wave, then in a flat correction the “B: wave could go to either 1226 or as high 1241, before we see the final “C” corrective wave. We will look for candlestick patterns at the Fibonacci retracement levels for confirmation of a top and bottom of that wave.
We have an incomplete piercing line pattern our daily Forex gold chart. The last two trading days on this chart form that pattern. The piercing line pattern in Forex will open at the prior candles close and close at or above the midpoint. In this example the close does not reach or exceed the midpoint of the previous black candle. I have found in my research that if we get a confirming candle, which would be a red candle with both a higher high and higher low, then this pattern can prove to be a reliable signal. Although quiet from the holidays, it has attempted to form a base at 1203. If so we might be witnessing the beginning of wave B, the impulse wave within the corrective phase. If it cannot find support at 1200, then the next support level would be 1187.
If this corrective wave “A” continues to trade lower the next logical point to see it find support would be 1187.00 or a 78 % retracement of the fifth wave as seen in figure 4B. We will see over this week if the 1203 (61% retracement of wave 5) proves as I believe to become a support level and the low of Wave A.
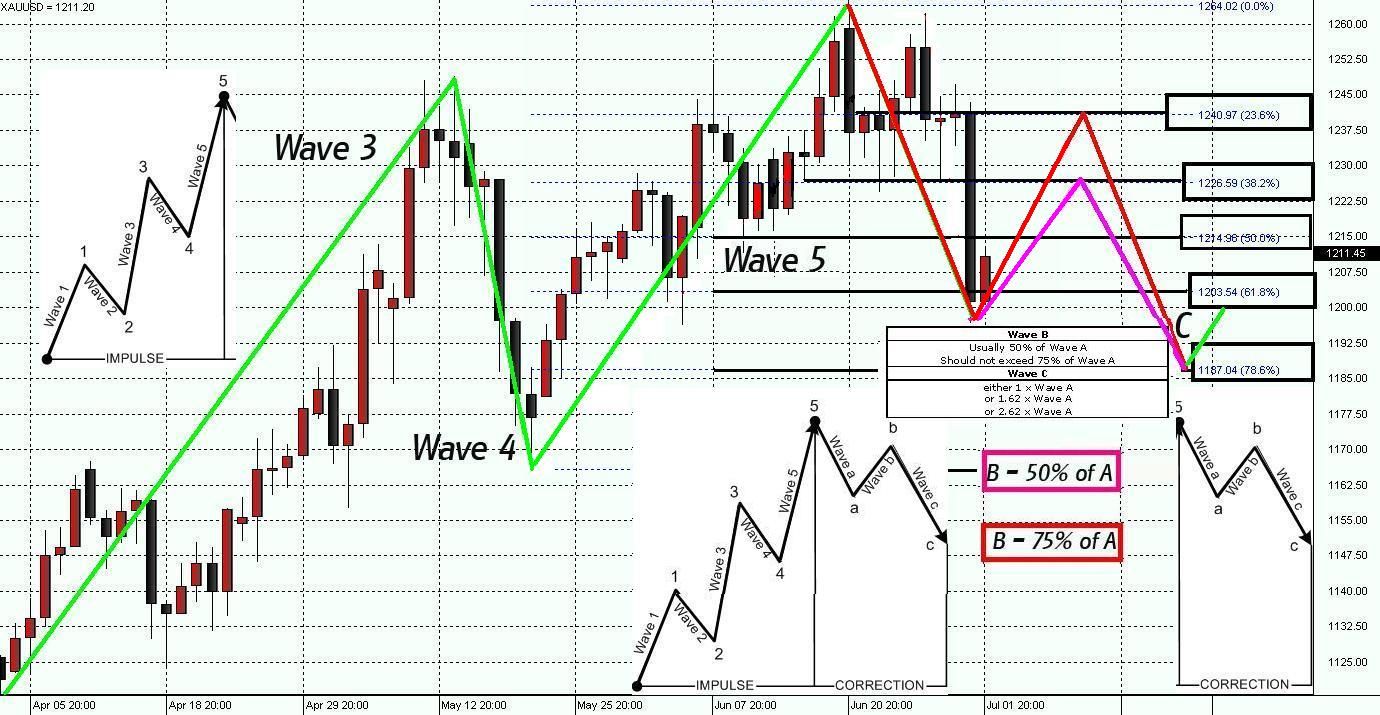
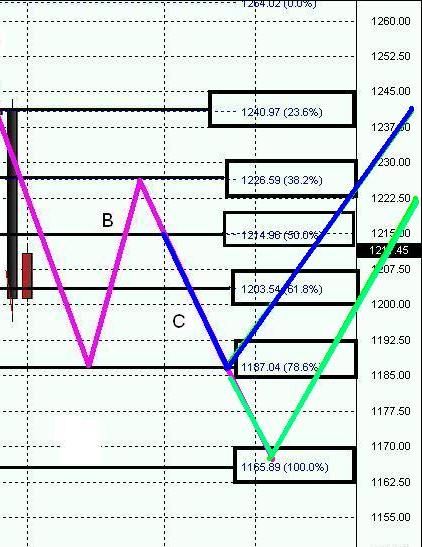
Figure 5 is a daily chart of Forex gold projecting what a zig-zag correction might look like if we have entered a standard corrective phase. In such a scenario, and if 1203 proves to be the support level for corrective wave “A”, then figure 5 shows how gold might trade. For this type of corrective phase to occur, the low of wave C would have to be below the low of wave A. Figure 5 shows such an example.
According to Elliot Wave theory the following describes the psychology during a zig-zag corrective phase (this from the Left Anchor website)
Wave A: In a manner analogous to the wave 1, the wave is the most difficult to identify this phase. During the development of the wave A is still the most economic news will be positive and most of investors, traders, and analysts see no more than a correction within a bull market valid and active. A sign of this wave, again similar to the wave 1, is the increase in volume.
Wave B: Clearly corrective in which many take the opportunity to resume the uptrend but in reality this is no longer valid because we are now clearly at the stage of corrective trend. There may still be positive news but I begin to hear negative fundamental data. The volume during the development of this wave is far less than it had during the wave A.
Wave C: The main feature of this wave is the fall in price with marked increase in the volume, and fundamental economic news commensurate with the market’s negative sentiment. The C-wave amplitude reaches the 161.8% Fibonacci extension of the wave A or lower.
Are we in a simple market correction or the start of a corrective phase, no one knows the future for certain. We will only know after time has passed and we look back over the next few months. One thing we can say is that using Elliot wave, Fibonacci retracement and candlestick patterns has provided much insight and relevant market information. Properly used it can guide the trader/technician with reliable information
I have an underlying market bias, as I am extremely fundamentally bullish on gold long term. I think that over time it will continue to increase in value. I think that before we see a new record high we will enter a corrective phase. We need to pay close attention to our market indicators and plan accordingly. Where gold trades, is something we can all speculate about. However I am certain of two things: First, gold will offer us an opportunity, an opportunity for great successes, if we know how to correctly analyze it. Secondly, the gold market will also offer us moments of uncertainty. It is my hope that the technique contained in this blog will allow you to experience more successes in your trades and less uncertainty in your market analysis.
Best,
Gary S. Wagner
Gary S. Wagner a technical market analyst for twenty five years is the executive producer a daily video newsletter “The Forex Gold Forecast tm” for wfgforex.com. He is the Co-author of “Trading Applications of Japanese Candlestick Charting”. A frequent writer for Technical Analysis of Stocks & Commodities magazine, he also Co-developed software applications for market forecasting. He produces. Gary can be reached at ga**@wf******.com
REFERENCES
* Gary S Wagner & Bradley Matheny - Trading Applications of Japanese Candlestick Charting (Wiley, USA)
* R.N. Elliott, R.N. Elliott's Masterworks New Classics Library, 1994
* Alfred John Frost, Robert Rougelot Prechter, "Elliott wave principle: key to market behavior", New Classics Library, 20th edition 1998
* Gregory Morris - Candlestick Charting Explained: Timeless Techniques for Trading Stocks and Futures (McGraw Hill)
Thank you very much. The more i learn about Elliot Wave the more I see how insightful it can be. In the casr of Elliot Wave, a little knowledge can be harmful.
After 15 years of use of EW, I think I'm just now getting to know how to use it.
pleased to read such a nice article written by a person having deep and true knowldge of wave theory
Adam, i think we need to have your input on crude oil now...it's been awhile.
Leo,
Should be out later today or first thing in the morning.
All the best,
Adam