
 Today's guest is Markus Heitkoetter, CEO of Rockwell Trading and author of “The Complete Guide to Day Trading.” Today Markus is going to show you how to use one of our favorite indicators, Bollinger Bands, in short term trading. Be sure to comment with your thoughts on Bollinger bands and some techniques that you use in short term trading.
-----------------------------------------------------------------------------------------------------------------------
Bollinger Bands are a great indicator with many advantages, but unfortunately many traders don't know how to use this amazing indicator. Before I show you how I use it, let's quickly review what exactly Bollinger Bands are.
Bollinger Bands consist of three components:
- A simple moving average
- TWO standard deviations of this moving average (known as the Upper and Lower Bollinger Band).
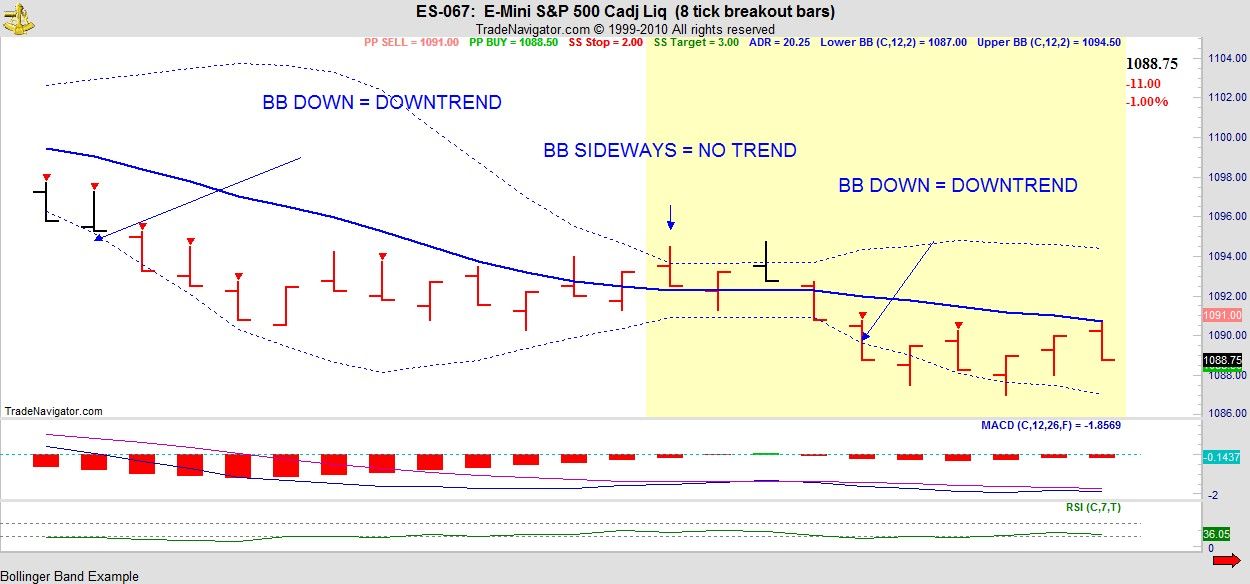
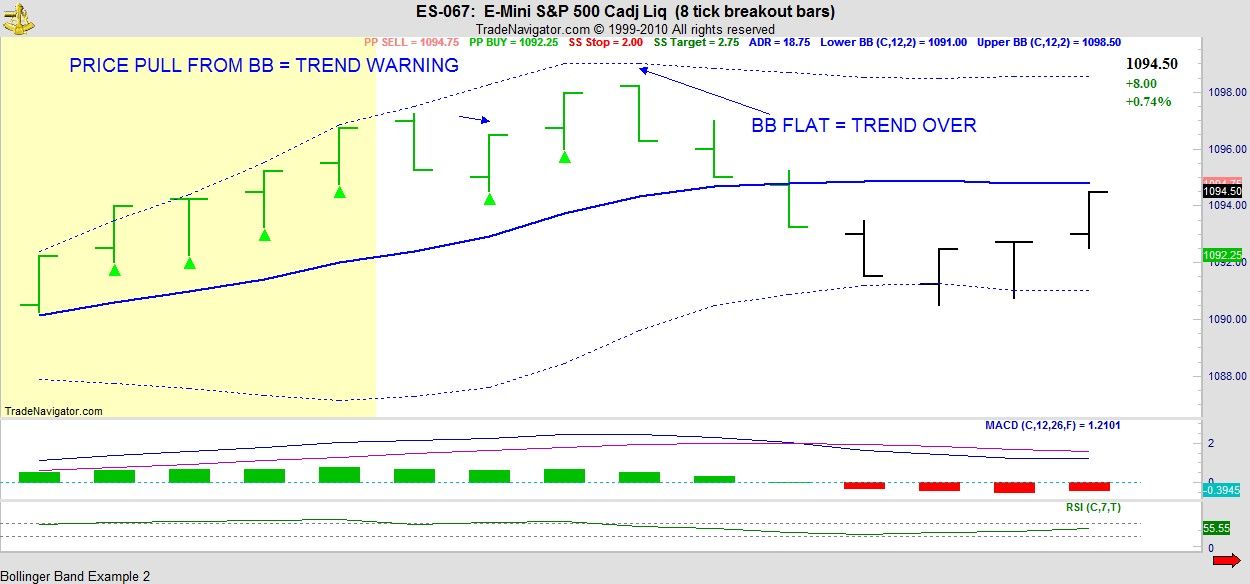
If you look at the following images you see the Moving Average displayed as a solid blue line and the Upper and Lower Bollinger Bands as dotted blue lines. (In MarketClub the lines are red.)
So what are the characteristics of Bollinger Bands?
Depending on the settings, Bollinger Bands usually contain 99% of the closing prices. And in sideways markets, prices tend to wander from the Upper Bollinger Band to the Lower Bollinger Band. With this being the case, many traders use Bollinger Bands to trade a simple trend fading strategy: They SELL when prices move outside the Upper Bollinger Band and BUY when prices move outside the Lower Bollinger Band. This actually works reasonably well in a sideways market, but in a trending market you get burned.
So how can you avoid getting burned? By understanding the direction of the market.
I use indicators to determine the direction of the market, and decide whether the market is trending or not. And Bollinger Bands are one of the three indicators that I use for this task.
For short term trading I prefer to use a moving average of 12 bars and a standard deviation of 2 for my settings. In many charting software packages the standard settings for the Bollinger Bands are 18-21 for the moving average and 2 for the standard deviation. These settings are great if you are trading on daily or weekly charts, but John Bollinger himself suggests that when DAY TRADING you should shorten the number of bars used for the moving average. John Bollinger suggests a setting of 9-12, and for me the best setting is 12.
With these settings you will find that in an uptrend, the Upper Bollinger Band points nicely up and prices are constantly touching the Upper Bollinger Band. The same is true for a downtrend: If a market is in a downtrend, you will see that the LOWER Bollinger Band is nicely pointing down and prices are touching the lower Bollinger Band.
How can you know when a trend is over and the markets are moving sideways again?
Well, the first warning sign that the trend might be over is when prices are moving away from the Bollinger Band. And you know that an uptrend is over, at least for now, when the Upper Bollinger Band flattens.
The same applies to downtrends: The first warning sign that a downtrend is over is when prices are moving away from the Lower Bollinger Band, so they are no longer touching the Lower Bollinger Band. And you know that the move is over when the Lower Bollinger Band flattens.
How can you use this information in your trading?
Well, if you use a trend-following strategy, you start looking for LONG entries as soon as you see the Upper Bollinger Band pointing nicely up with prices touching the Upper Bollinger Band. When you see that prices are no longer touching the Upper Bollinger Band, you move your stop to break-even and/or start scaling out of your position. And when the Upper Bollinger Band flattens, you exit your long position, since you know that the trend is over.
You see, when the market is moving sideways, you don't make any money being in the market just hoping that the market will continue to trend. So exit the position before the market turns around, because you can always re-enter when you see that the market is trending again.
In fact, a strategy I call the Rockwell Simple Strategy actually relies on price tagging an Upper Bollinger Band as an entry signal: With this strategy I use MACD to confirm an uptrend, and I wait until the Upper Bollinger Band starts to point up. I then enter at the Upper Bollinger Band with a stop order, waiting for the market to come to me. I am then using a stop loss and a profit target based on the AVERAGE DAILY RANGE. This strategy is really beyond the scope of this article since we are focusing on Bollinger Bands, but this is exactly how I use Bollinger Bands to determine the direction of the market and decide on the trading strategy I will use.
So as long as the Upper Bollinger Band is nicely pointing up or down, I am looking for entries according to my trend-following strategies like the Simple Strategy. Once the Bollinger Bands flatten, I am looking for entries according to the sideways strategies I trade. You always want to trade a trend-following strategy in a trending market and a trend-fading strategy in a sideways market.
As you can see, Bollinger Bands offer tremendous help to determine the direction of the market and decide what trading strategy to use. Many traders learn how to use Bollinger Bands to fade the market, but they can be even more powerful when used to trade trends, and in determining the direction of the market.
Best,
Markus Heitkoetter
Markus is CEO of Rockwell Trading and author of the international bestseller “The Complete Guide to Day Trading”. For a limited time INO Blog Readers can download his book free here.
Thank you .Your article about BB is very good.
Really BB is a good indicator to measure the volatility.They act like support & Resistence. I use BB with candelsticks supported by price and volume indicators.
I would like to know how you trade BB squeeze.
For me the Squeeze or constriction is a opportunity to catch breakouts,and if you antecipate your order your r the winner.But sometimes is very difficult to know if the breakout will go up or down.Can you tell me how you trade this strategy?
FROEHES WEINACHTEN
excellent strategy, been studying bolls for some time - £3000-7400 in one month.
Hi Markus,
Thanks,
Pan
oscar moreno?
You are exactly right. Too many people have so much going on their charts they are too late on making a move. I trade options and love Bollinger Bands.
I also have found that the Bolinger Bands work best in a sideways market along with the MACD Histogram.
As for Mohamad we all had to go through the learning curve and obtain information wherever we could. However there are a lot of education sites available to you and many books on the subject of stock trading.
Best of Trades
Yes, la Morhamad, you are the definition of "stupid money." I don't have an opinion on Arabs. In all honesty the middle east religions confuses me so much I don't even bother trying to figure everything out. I wish I had the time but I don't. I have nothing again't Muslims. I'm not an arrogant or culturally insensitive person and my comment had absolutely nothing to do with you're race, ethnicity or religion. I'm aware of the fact that this is a big world and we have a lot of different people with different people living in it so how bout we leave it at that?
The reason I called you stupid is not because of your poor grammar. I'd assume English is not your first language and that is fine. I was able to understand your message fine which is why I called you a stupid investor.
If you invest money in something and don't have a set exit strategy and have to ask random blogs about what you should do with an investment/trade (bet) that didn't go your way than you're what people in the investment world refer to as stupid money. I have nothing against people like you because you help people like myself and others here at MarketClub money by taking the wrong side of a position.
But smarten up, do your homework, stop with the racist card then come back and invest.
You Iajustin Miller says about me stupid Why do you say I am stupid ... Thank you .. this morality you have.
Znntek will contact me on my email for you to help me .. Do you like the Arabs.
sounds good if we can read the trend market with this method
mohamed,
Take the loss. With the level of intelligence you're likely to have based on the grammar in your sentence you have no chance.
Just stop trying to make money when you haven't an F what you're doing you idiot!
You can play as much as you want with different indicators settings, none will be better or lesser than the other. A setting will work nicely for a while then not so well afterwards. Use it on another underlier then it won't work at all...etc.... you get my point.
So I use very few indicators with the defaults settings given in every software.
Indicators are just what they are "indicators" but the real thing is the tape. So learning reading the tape is the must be done and main focus.
I thought many traders liked to adjust the MACD default settings for short term trades... But I guess in this case, the default are sufficient but I'd be interested to hear from anyone who has had success trading intraday (especially ES) with different MACD settings.
Justin
Bruce de Poorman,
Thanks for the feedback. I've been testing different MACD settings for short time trading but so far my back tests have had little success. I'll give this one a try.
As for the ATR, have you considered a 10 period? You might find this works well with intraday trading.
Justin
mohamed,,,,, i see no one is answering your 911 call for assistance,,,,, i don't really understand what you need,,,,,
did you get stuck in a position, are way down, and need advice for making it back quickly???? is their a time element on your transaction???
don't panic,,,,, it's just money,,,,,
ô¿ô
Don - to get 15 days to show up it had to be 30 minutes chart for the chart examples above. Poormans.
THE BOLLINGER BANDS ARTICLE WAS VERY INTERESTING. I'M JUST CURIOUS AS TO THE TIME FRAME THAT
WAS SHOWN ON THE CHARTS. WAS IT A 5 MINUTE OR WHAT?
Is there any one help me in any way .. even if it has no index effectively sends it to me in order to compensate for my loss big .. on this .. Emily Mohamad 14 7 1 @ hotmail. Com
Doc Stock - I think the principles are the same except RSI is 14 instead of 7 and the default BB setting is 20,2,2 instead of 12,2.2. and I think MACD setting remains the same as he already is using the standard default setting. This of course would be on the daily or weekly charts.
Interesting... I just recently added this to the weekly chart. I wonder what his thoughts are on the use of the BB for longer term charts. Nevertheless, it is another tool that is helpful, despite it being a lagging indicator.
Justin, there are 4 videos and I looked at 2 of them today, one on Bollenger Bands which is much like the basic note and the #3 is on use of MACD with the BBs. The BB setting he uses is 12,2,2 for the S&P 500 and it is a 30 min chart (to get 15 days to show up). ATR - don't know that one. We were trying different settings including the 2 min chart. Wilder RSI normally is 3-7 for short term trading. I have never had success with short term so I have been a longer term investor since 1987, but the last 4 years the longer focus has nearly disappeared and I am looking to modify my investing.
Bruce de Poorman (looking to change the name)
Anyone wanting to make 500% in 4 months has a realistic and very accessible goal. The maths are easy. My own trading goal is 10% per week, compounding. So $1000 starting balance looks like this - 1100, 1210, 1331, 1464 (month 1), 1610, 1771, 1948, 2143 (month 2),2358, 2593, 2853, 3138 (month 3), 3452, 3797, 4177, 4595, 5054 (month 4= 500% - allowing 17 wks in a 4 month period). To achieve this without overtrading is just a matter of maintaining your risk management and I increase my lot size accordingly with each trade so it reflects the growing balance to maintain the exact ratio as when making the initial trade. Forex has taken me on quite a journey and when I arrived at this goal and the discipline to trade in this manner I have found my trading to be successful. Depending on the number of days you want to trade it can be broken down again to 2%(always compounding) daily if trading 5 days or 3.25% if trading 3 days per week which is my preferred option as it allows for days where the highest potentially profitable trade/s don't present themselves or if 10% is reached in less than 5 days there is the option to walk away from trading for the remainder of the week, satisfied with reaching my target and preserving my capital.
Hope this helps as Forex provides the opportunity to have big dreams but like anything it's the breaking it down into sizeable chunks that allows us to see the possibility is there.
Hey Bruce,
How can you tell the setting from these pictures? On my end, they're really blurry.
I'd also really appreciate it if you would share a few setting for the MACD and the ATR for intraday trading. And by the way, this is a great post, which I haven't seen in quite some time!
Thank you!
Look up Ira Epstein Futures o Youtube, he uses BB, Stochastics, and mov avg to explain market trends...,very simple approach he takes to bring together, along with his proprietary swingline study to time entries and exits.
Some great comments! Poorman, I'm glad you were able to take a look my indicator videos. Yes I do use standard MACD settings to help determine the direction of the market (12, 26, 9). I want to avoid analysis paralysis from using too many indicators, but I feel it is important to use 2 or more indicators (I use 3) to determine the direction of the market and have found that MACD and RSI are nice compliments to Bollinger Bands.
Dee Dee, thanks for your post! You are correct. Bollinger Bands based on 2 standard deviations theoretically will contain 95% of price data, but this isn't always going to be the case since this assumes a normal distribution and markets aren't always "normal".
Markus
as I stated earlier:2010-09-16 09:50:24
The number of the data point contained within the envelope of the bands is defined by Chebychef’s (aka Tchybechef) Inequality and the 2 standard deviation bands alway contain “more than” 75% of those contributing data points. That is not to say those 2SD bands could not contain 99% of the contributing data points but that would be highly unlikely. In order to be absolutely sure of that envelope containing 99% of the data points one has to use bands set at 10 standard deviations.
This is true of ANY distribution of the data (see ASTM STP-15)
Actually BBs do not contain 99% of the data. Security prices are not normally distributed. At 2 standard deviations normally distributed data is 95% contained, but security and forex prices are closer to 93%. I recently read John Bollinger's book, Bollinger on BBs and he has some great insights. I started using his forex website, BBForex.com and it has great forex charts with a wide choice of indicators---it has been a real improvement for my trading, but I still don't make 500% in four months--that's very impressive.
Ok, I found the MACD setting (12,26,9). What does URI stand for on the posting requirement?
Watched 2 of the Rockwell videos and learned more about the BB and combined with MACD, looks like some good short term tools. Have been a longer term investor since 1990, but finding the going rough the last few years. Never traded short term before as it always backfired with longer term tools. I really like the potential here. On Poormans chat a friend tried it on VHC today and $211 in 11 minutes. Thanks.
...and using leverage, why not 500%?
Why is Sur ludicrous?
Some people are constistent only using positive and negative MACD divergence, why should BBs be any different?
Sometimes over analysis is the worst analysis. What about people that are consistent using the breakout/pullback method?
Not eveyone has a chart full of indicators.
I'm still learning, but to me, the more cluttered the chart, the less you see.
All the best.
I lost a lot of money and my balance became $ 1000 Can I Compensation I do not have money for promotion .. Is one help me in order to compensate the progress of my entry and exit points in trading this my email .. I hope anyone help me
Well, perhaps he made 500 starting out with 100 dollars 4 months ago. It is possible:)
This is terrific info. What setting do you use for MACD? I see the sample is 30 min and bb of 12,2,2 setting.
Thanks
BB are a volatility indicator, when they are closing the volatility decrease, when they are diverging volatility is back.
when they are parallel a trend is going on, when they make a bubble you have a strong burst.
BB are a trend reversal indicator, when the top BB bend down the up trend is probably over, when the bottom BB goes up the down trend is over.
You need to watch them carefully and learn their behaviour, it one a very reliable indicator.
Another indicator deserves attention, it is the Parabolic SAR, combine them both for confirmation.
All the best
How ludicrous.... 500% in 4 month... With a simple Bollinger band. No body would be working anymore. To become consistent on 20% per month on your trading account you need a lot more then a Bollinger band. By consistent I mean over a couple of years. I can’t stop laughing. Not that it’s worth while answering but I couldn’t stop laughing.
It is about time we saw an application of this powerful trend defining tool. However there are issues with what was claimed to define "exactly" what they are. The upper and lower bands are the standard deviation of the data point in the sample not of the (moving)average. The uncertainty in the average can also be defined by its standard deviation as can the uncertainty in the uncertainty in the uncertainty of the average etc. One can also determine the standad deviation in the value of the standard deviation etc. All these uncertainty values are detwermined by a formula that has "n", the number of data points in the denominator so be aware that larger samples reduce all the uncertainty in the statistical summary of the data set. There are many who would not consider samples size smaller than 20, which is the usual default size for Bollinger Bands in market data analysis.
The number of the data point contained within the envelope of the bands is defined by Chebychef's (aka Tchybechef) Inequality and the 2 standard deviation bands alway contain "more than" 75% of those contributing data points. That is not to say those 2SD bands could not contain 99% of the contributing data points but that would be highly unlikely. In order to be absolutely sure of that envelope containing 99% of the data points one has to use bands set at 10 standard deviations.
An important point, not made, is that the width of the bands is important. As bands narrow there is increasingly greater confirmation that the current price is the right price while broadening band indicate that recent transactions disagree that the price is well defined. A funnelling other than horizontally indicates confirmation or lack thereof of the trend.
I use 100/3 on the 15 minute data values in a 5 day chart and they seem to give me useful information. From my experience there is a limit to the prediction value to only about one-third or less of the sampleing period.
Thank you, I like the BB explanation, I use Q Charts and have the the Upper and the Lower BB set for all my trades.
Thanks, this is the only indicator that I use consistently and have made 500% return in last 4 months. Even though its hard to believe but this is the reality of my forex trading. When I started to trade for the first time in June '10, had no previous trading experience. Now I can give all the credit to this indicator for most of my FOREX profit This made a great fan of BOLLINGER BAND. My strategy was to refrain from entering a short position at the bottom of the lower band and long position at the top of the upper bollinger band. I would like to thank David for his informative video lesson at InformedTraders.com, recommend everyone to watch those videos.