
 For 37 years, Personal Finance has helped investors beat the market—in bull and bear markets. Today, editor Elliott Gue shares his #1 tip for not just surviving, but thriving in this volatile market. Be sure to comment with your own tips and visit Elliott at Personal Finance.
---------------------------------------------------------------------------------------------------------------------------------
There’s an old concept in statistics and economic modeling known as parsimony—or, simply, less is more.
Economic models and analysis that rely on the consistent application of fewer indicators often yield better and clearer forecasts.
Unfortunately, most of today’s market “experts” have apparently never heard of that concept.
Former Federal Reserve Chairman Alan Greenspan was famously fond of obscure economic statistics and data points. Economists in general love to underscore arguments with pet indicators or proprietary indexes.
And the financial media love to hype any of the hundreds of economic data reports that are released every week.
All of these indicators never point in the same direction at the same time, so if you try to follow them all, it can lead to confusion, frustration and some really bad investment decisions.
Let me show you a smarter way to cut through the static and get to the truth about the economy and what lies ahead for the market.
A Day Late and A Dollar Short
The best way to avoid falling into these traps is to identify and follow a set of indicators or data points that have a reasonable track record of success.
A major mistake that many investors make when evaluating economic indicators is to focus too much attention on lagging indicators. Lagging indicators often deteriorate after the economy is already in a recession and improve after conditions have troughed; stocks often post their biggest gains in the first six to 12 months after the economy exits recession.
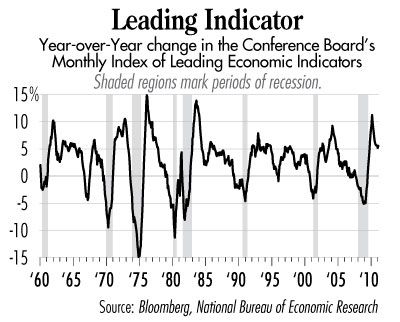
My favorite quick and simple indicator of the US economy’s health is the year-over-year change in the Conference Board’s Index of Leading Economic Indicators (LEI). When this year-over-year change is negative, it’s a good sign the US is headed for recession; when the year-over-year change in LEI turns up, it’s a signal that recovery is on the way.
This graph tracks the year-over-year change in LEI going back to 1960. The official start and end dates for every U.S. recession since 1960 are shaded.
The Business Cycle Dating Committee (BDC) of the National Bureau of Economic Research (NBER) is the accepted official arbiter of the beginning and end of US business cycles.
But the business cycle dates provided by NBER aren’t particularly useful for investors, save for historical purposes.
It wasn’t until December 2008 that the NBER established that the most recent recession started in December 2007. Then, in late September 2010, the NBER finally declared that this recession had ended in June 2009.
Not exactly the type of advance notice that you need to profit and protect yourself.
But those of us who follow LEI DO typically get an advance warning. As you can see in “Leading Indicator,” the year-over-year change in LEI has turned negative before every recession since 1960.
In the most recent cycle, LEI flashed recession in October 2007, two months before the downturn started. At that time, many economists and market pundits—armed with more complex models—forecasted only a short-term slowdown or a shallow recession.
In July 2009, when many pundits called for continued weakness and the potential for a second financial crisis, LEI turned positive, indicating the recession had ended. Investors who followed these signals would have avoided being overly invested in 2008 and early 2009, one of the worst periods for U.S. stocks in market history.
And those who saw the signal to buy in summer 2009—as I did—participated in one of the most dramatic rallies in the past century.
Best,
ELLIOTT H. GUE
Editor, Personal Finance
Learn more about the leading economic indicators we use to stay one step ahead of the market and get free instant access to my three newest Special Reports here.
imo, the Economic Cycle Research Institute (ECRI) gives better, more reliable and timely warnings of economic turns (down and up) with their Weekly and Long-term Leading Indicators. They have been warning since January, before the Japan tsunami, that there would likely be a persistent downturn in global industrial activity and jobs growth around mid-year. We are right there now, and the markets have been complying. Their lead guy, Lachsman Acuthan, has been pounding the table about this for months. He warns that it will be deeper and longer than just the "soft patch" euphemism being thrown around in the media, though it might not result in an official recession.
http://www.businesscycle.com/news/press/2202/
Not to be a buzz kill but why then in the tech wreck we came out of the recession at the end of 2001 then why did the market not bottom until end of 2002-03, With this one it was middle of 2009 but the market bottomed in early march charts dont match, And the Conference board of leading economic index is the same as the G-17, I go by the Advanced report on Durable goods gives me a better understanding of spending and the all important Orders shipments and Inventory's.
http://www.conference-board.org/pdf_free/press/PressPDF_4201_1305793472.pdf
http://www.federalreserve.gov/releases/g17/Current/g17.pdf
http://www.census.gov/manufacturing/m3/adv/pdf/durgd.pdf
You would of seen the recession started in early 2007 way before any of the bobble heads, And the markets kept going for another year before collapsing, Inventory's right now are at dizzying heights.
The advice on this indicator is "When this year-over-year change is negative, it’s a good sign the US is headed for recession; when the year-over-year change in LEI turns up, it’s a signal that recovery is on the way." This staement doesn't seem helpful on it's own. In between the grey zones there are lots of year over year declines that didn't result in a recession. It would sem that a recession did occur when the LEI had a year over year drop AND was below 0. Comments?
Only one way can be right... the only people that know for sure are the ones pushing the buttons...
If you go to this web page:
http://www.conference-board.org/data/bcicountry.cfm?cid=1
At the upper right hand corner you can open the press-release PDF file with the publication of the monthly results. There is a simple graph included.
Should at least give an overview of the indicator if followed monthly (saved from your favorites).
As this article states, this is a longer term leading indicator, so there is no use in having to have it available on a daily or weekly bases. Seems to me that a monthly update should fulfill the purpose!
Cheers,
Robert
I googled this below, I'm still looking for the indicator.
CL
The index of leading economic indicators (LEI) is a composite of the following 11 leading indicators:
Average workweek (manufacturing)
Initial unemployment claims
New orders for consumer goods
Vendor performance
Plant and equipment orders
Building permits
Change in unfilled durable orders
Sensitive material prices
Stock prices (S&P 500)
Real M2
Index of consumer expectations
Yes, I would like to have a LEI chart handy, where do you find it ?
Thank You for the blog
CL
To read more in-depth about the LEI I found this article from Mr Gue.
Does anyone know where we can find a "dynamic" version (updated regularly) of the graph of the "yr over yr change leading economic indicator"shown above?
I checked the Conference Boards website and the National Bureau of Economic Research website and could not find the graph on either of those?
Any suggestions? Thank you!