
 Today we welcome Michele Schneider to the Trader's Blog. Michele is going to share with you how she uses the 200 day moving average to trade. Michele "Mish" Schneider is the Director of Trading Education & Research for MarketGauge. She provides in-depth trader training as the market analyst, writer and host of Mish's Market Minute, contributes to several online trading publications a series of trading strategy articles called Taking Stock, and serves as a regular contributor to MarketGauge's free newsletter Market Outlook.
The 200 day moving average may be the granddaddy of moving averages. Simply put, a financial instrument that is trading above it is healthy; below it, anemic. The 200 day moving average measures the sentiment of the market on a longer term basis. This is where major players like pension plans and hedge funds need to look in order to move a large amount of stocks. I display it on all my workspaces proudly, formatted in emerald green and real thick so I can't help but notice.
Not only am I always interested in a stock, ETF or future's price movement in relation to the 200 day moving average - I also study the slope, the distance it is from price action, and its correlation to some other moving averages, particularly the 10 and 50 day. For instance, where the 50 in particular is in relation to the 200 day moving average determines the phase of the overall market, ETF, or financial instrument. Please refer to this article on trading phase changes. We also have a swing trading course which covers ETFs and the 6 Phase Changes in depth and a tool called the ETF Monitor that tracks the phases learn more about these here.
Longer moving averages like the 200 lag. They tend not to predict price direction, but rather reflect current direction. Therefore, when you hear "the trend is your friend," technically put it really means that the price over the last 200 days is indicating an upward trend, therefore look for buy opportunities; versus the price is below the last 200 days, therefore look for sell opportunities.
Moving averages are also good indicators for support and resistance. Since so many traders and investors watch the 200 day, once a price point reaches, fails or holds it, the collective psychology creates an immediate impact. Over the longer term, even psychology won't sustain the price action as the collective group is fickle. But, for a short term play, it works out amazingly well.
Furthermore, if the price of an instrument is far above or below the 200 day moving average, the reverse happens: a price way above could signal an overbought condition and way below - oversold.
Let's examine 3 ways I use the 200 day moving average:
- Trend - Where is the price in relation to the moving average: below, above or touching it?
- Slope - Turned up, down or neutral (no slope at all)?
- Crossover - The relation of the shorter term moving averages to the 200 - have they crossed over, under, touching?
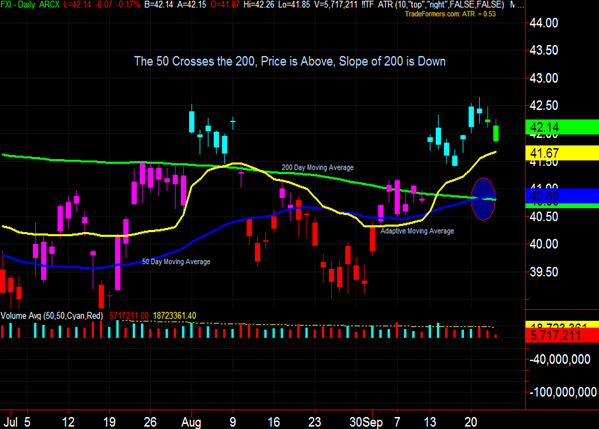
FXI: The price is above the 200 day moving average - trend is up. The price is well above the 200 day moving average and the slope of the line is down. That tells me not to chase it at current levels. The 50 crossed over the 200 day moving average-trend can now change back to bullish from accumulation, but with a downward slope, patience is called for. One can either wait for the price to get closer to the 200 day moving average, which should now act as support or, wait for the slope to turn up along with another signal like consolidation around a daily support level or a test and hold of the adaptive moving average. Ideal scenario is that FXI finds support at the 41.40 level, doesn't fill the gap left from September 13th and the 200 day slope turns positive - all with an entry point that gives us good risk/reward.
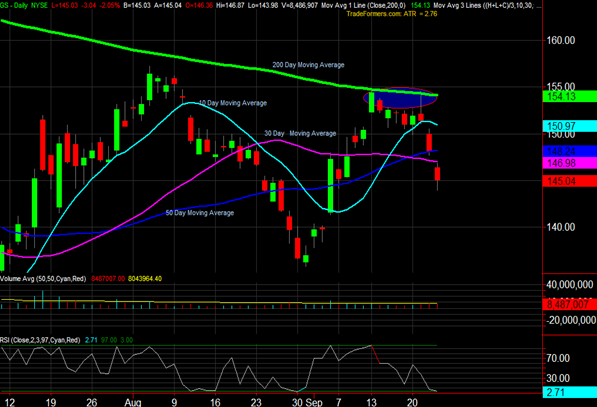
GS: The price is below the 200 day moving average - trend is down. The price is considerably lower than the 200 day moving average at time of writing, but on September 21st it rallied up to the 200 day, thereby acting as a perfect resistance point - with a low risk short opportunity. Slope of the 200 day moving average is down and has been for quite some time, but now it is turning more neutral. Plus, the other shorter term moving averages (10, 30, 50) are all beneath the 200. Furthermore, although the 10 crossed over the 50 day the week of September 13th, the slope of the 10 is down - so a weak indication. Now, the slope neutralizes on the 200 could mean that the bear trend is coming to an end. For signs that GS momentum to the downside is waning: watch for a move in price back over the 50 day moving average, and/or the 10 day moving average to turn up and then cross back over the 200. Of course, a move back over the 200 day moving average would be considered a phase/trend change. For signs that the weakness will continue with the possibility of the price heading back to the lows look for: A failure for the price to cross back over the 50 day moving average, the slope on the 200 day to turn down, and/or the 10 day moving average to cross below the 50.
When one considers the trend, slope and relationship the 200 day moving average has to price and shorter term moving averages - whether you are a day, mini or swing trader - employ it as a compass for your trading.
Happy Trading!
Michele "Mish" Schneider