
 By Gary Tanashian
The 30 year / 2 year Treasury yield curve has been on a steady march higher since 2007. This makes sense since that was the year things started falling apart in inflated, debt saturated developed global economies, led by the nation that showed 'em how it's done when it comes to economic management by inflation; the US.
When long term yields are rising faster than short term yields, it is a sign of stress building toward either a breakout in inflation expectations or, as has been the case thus far since 2007 (and really, since the age of Inflation onDemand began in 2001), impending reversal of the excesses. Unfortunately, in an age where economies are managed by inflation (by monetization of Treasury/Sovereign debt in service to increasing money supplies) these reversals tend to be shall we say, violent.
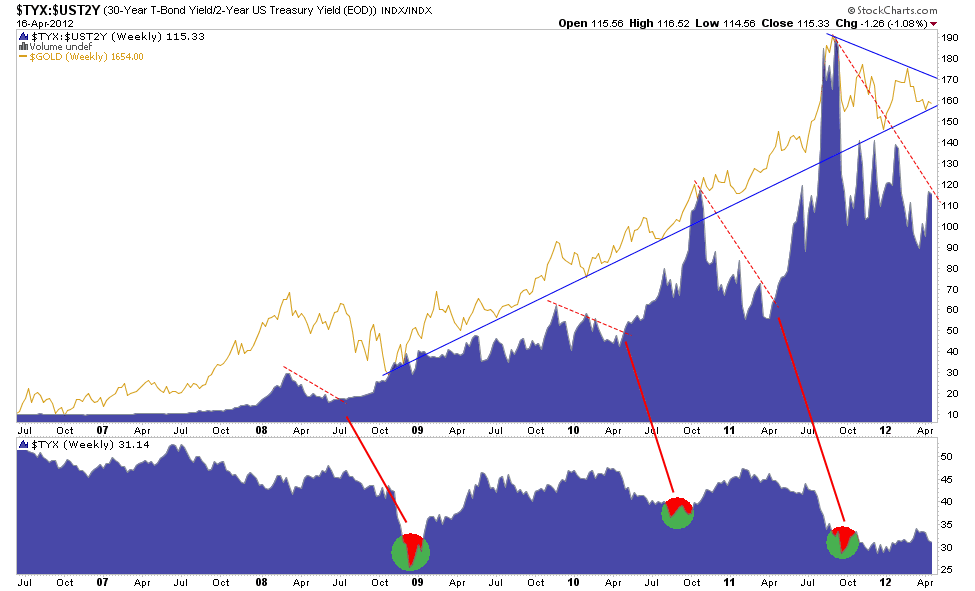
Without conjuring too much theory about the Treasury bond market's yield relationships, let's just say that a rising curve (top panel) has accompanied ever higher moral hazards being baked into the macro cake. As shown, the monetary value anchor, gold, has moved up right along with the curve. But like the curve itself since the Euro ignited blow off in 2011, Au has been mired in an intermediate down trend. It all makes sense, at least when comparing the yield curve with the monetary relic which has not yet by the way, broken down from what still qualifies as a Symmetrical Triangle, which is usually a bullish pattern.
But enough on gold, it will go up or it will go down in the short term. What we are interested in today is what the yield curve in the top panel may be indicating for the nominal 30 year yield in the lower panel and from there, what the nominal yield may forecast.
Very clearly, when the curve has increased and then played out a consolidation/correction (red dotted lines) as it is now doing, a decline in nominal 30 year yields and a deflationary and/or crisis episode has played out each time within a few months. The 2008 decline in the curve forecast 'Armageddon 08', centered in the US (this was the 'lever' to QE1), the 2010 decline forecast the 'Flash Crash' and associated liquidity
problems (this was the 'lever' to QE2) and the decline in 2011 forecast the phase where Europe's sovereign debt structure began to come apart at the seams (this was the lever to the ECB's version of QE as its balance sheet was expanded to deal with the crisis, while the US financial media got to pretend it was Europe's problem and if not for that all would be fine).
Well, the yield curve has been in decline since the acute phase of the Euro crisis and its correction has been exacerbated by the Fed's stated intention of selling short term T bonds and buying up long ones. This has painted 'Goldilocks' into the picture, pressured the precious metals and commodities, and given the stock market a reason to bull without those nasty inflation concerns that tend to make the Fed's policy makers sensitive to criticism.
But we have another red dotted line indicating a correction/consolidation on the chart. Is it different this time or is the curve again forecasting that a deflationary 'issue' will be cropping up later in 2012? Taking it further, would it not be a convenient excuse for Dear (monetary) Leader to come to the rescue once again?
We have been following the RPG (real price of gold) and other macro 'tools' closely and they have not yet given a signal as to sufficient pressure for coming QE-style inflationary policy. But the picture above says that in this election year, it could be coming soon if previous relationships prove valid in the current situation. Considering how low nominal yields are already, what kind of policy response would you think might meet a deflationary episode? I think it could be a decisive one.
Then again, maybe this time it will be different.
It seems to me that the writer(s) of this article preasent a good case for a forthcoming period of DEFLATION. Bernanke FEARS deflation almost as much as gold. Now, Whom does deflation hurt? Not the poor strugling person on Main Street. It HELPS him to survive with LOWER prices. It hurts most the ones at the top: no price increases, lower wealth values, decreased paper currency games, etc. Gold and silver's behavior during the past three months seems to be predicting deflation. For gold and silver that meansa lower paper currency prices, but their VALUE will remain CONSTANT.,
I have been in mortgage banking for about 25 years watching economic numbers and what the Fed does very closely for purposes of the economy and interest rate direction. In my opinion I think the Fed is very concerned about Deflation not Inflation. It is so unprecedented that the head of the Fed would publicly come out and say their intentions are to keep the Fed Funds Rate near zero until about 2014. Does anyone even begin to understand the implications of what that really means? And to add to that, the European Euro printing press and Chinese monetary manipulation. I hate sounding doom and gloom. Fundimentally, what else is there?
You are correct in what you wrote, of course. I have commented on that before, with no response. It seems that most Americans (Europeans are willing to undergo austerity) prefer to ignore The Elephant (huge debt now ABOVE the GDP and nearly 0% interest rates for years) sitting in the living room since it would be very painful and very difficult to remove it. We (my wife and I) understand what will be the end result of the Fed’s policy, so we have converted 90% of our IRAs to Precious Metals and continue to do so.
Now, my explanation to why Bernanke would make such an announcement about interest rates is that, so far, cheap money available to the Carry Trade Gamblers has been supporting The Markets, but any remote hint or suspicion that the end of cheap money is near, would immediately collapse ALL The Markets, and probably take the Financial System and then the Economy with them!
No mention of the effects of Operation Twist on yields? Or the implicit guarantee of central banks around the world to support government bonds?
This is an Alice-in-Wonderland world and I'm not sure historical precedents hold good here.
No need to read any data or any charts, since long, and on global level, all financial simtums very clearly give us a signal of RED RED and JUST RED- 2007 - 2008 was only a sample, main show remains pending, and mostly, will be place after may june of this year, and may proove situation, even worsen then 1930.............
Rasesh Shukla
We are about to get a repeat lesson from the 1930's. I say hang onto your assets and not your debts. Get very liquid! You cannot mess with the FREE MARKET it will get you in the end. So, Good Luck to the Socialist running the USA and may God be with the rest of us.
What about this for Obama's last bombshell: Follow up on his FDR channeling and confiscate the gold and devalue the dollar in October?
Oh, no! What do we do when nothing makes sense?
There's always a silver lining.