
 Today we’ve asked Tony Edwards to share his favorite indicator with our readers. Tony Edwards has been an active independent trader for nearly 20 years. He trades an extremely wide range of instruments with a special focus on YM, ES, 6E, CL and GC. He offers traders daily, unique support and resistance levels (“TraderSmarts Numbers”) as well as Live Trade Alerts via www.tradersmarts.net.
Today I thought I would talk about my favorite indicator, the MACD.
I could start by telling you what the MACD is (stands for Moving Average Convergence Divergence and plots 2 lines and a histogram. The MACD line, or the fast line, is the 12 day EMA - the 26 day EMA, the signal line, or slow line, is the 9 day EMA of the MACD line, and the MACD Histogram is the MACD line - the signal line) or who invented it (Gerald Appel in the late 1970's) but instead I am going to tell you how I use and interpret it.
I primarily use the MACD for two purposes:
1. To help determine trade direction: for intraday trading I generally want to be trading in the same direction that the 30/60 min MACD fast line is moving.
2. To spot divergence: to identify when potential changes in trend may be taking place.
I will go into both of these more in depth below.
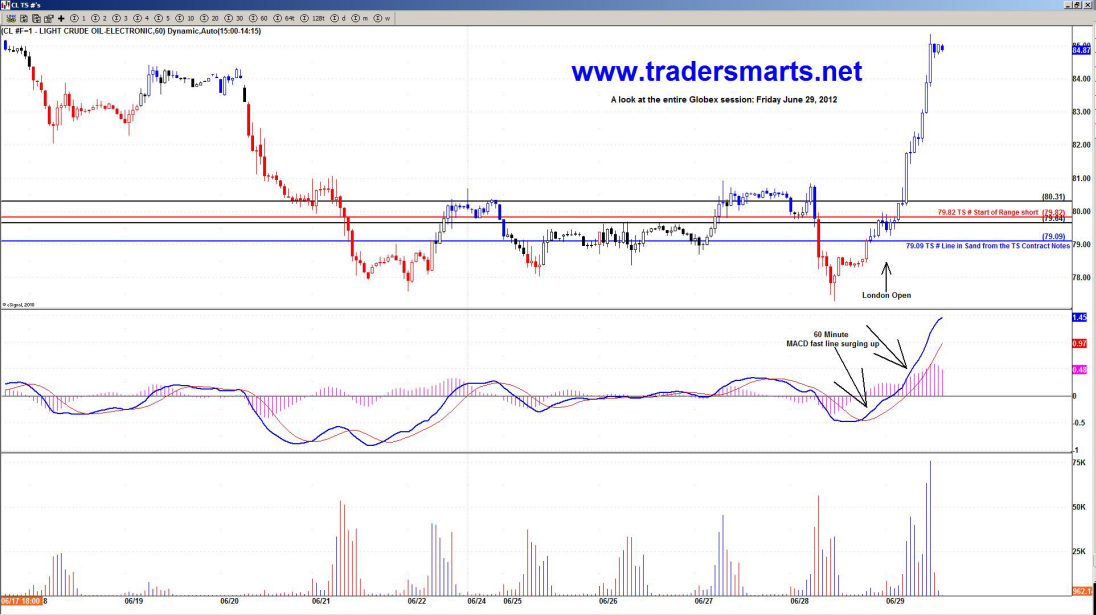
I started thinking about the MACD because of the move we had in oil (CL) starting early in Globex Thursday night and lasting throughout the entire session until the close Friday. The move initiated because of the EU agreement to stabilize the region's banks but the technicals had us tipped off early that a move up like this could ensue.
In fact back starting in early June 2012 when oil was at hovering between 87 and 81 I was telling members I was expecting a likely move into 80.31 - 79.64 TS #'s and once we got that we could start looking for a potential change in trend (CIT) and subsequent swing longs. We shorted the move from 85 in oil down to 80.31 and then we started looking for the potential CIT. Once we broke under the 79.64 TS # and were holding below my bias shifted to neutral with a bullish tint. I was telling members there was room to 73.85 to the downside and 89/96 upside from the then current price of 78 - 77. Immediate direction to be determined by which side of the 80.31 - 79.64 TS # Zone we resolved on.
The reason I was looking for this type of move down into 80.31 - 79.64 and then a potential CIT up from there was fourfold:
1. We had the ever important 80.31 - 79.64 TS # Zone that I felt wanted tested below before any significant move up could occur.
2. Oil made a significant low at the 81.15 TS # (N contract) on June 4, 2012 and tested it again on June 11th and 12th 2012 for a potential double bottom. However the test on June 12th I didn't feel was a valid test. The reason I felt it wasn't valid was we opened the Globex session on June 12th at 81.18, made a low of 81.07 pretty much right away, and then started moving up. By the time London opened CL was trading near 82 and even though we tested down to 81.36 shortly after the London open we never tested the TS #. CL pretty much rocketed up off the low made on the June 12th 2012 Globex open off the 81.15 TS # with no significant test in either the Europe, Asia, or US sessions. In my opinion that was not a valid test and that low needed to be tested during one of the major global trading sessions.
3. We were coming into contract settlement for oil on the 20th of June and in my studies I have found that significant lows are often made at or around settlement. We did in fact come test the 80.31 - 79.64 TS # Zone on June 21, 2012. One day after contract settlement. Note that the CL contract rolls every month.
4. The MACD on the daily chart was starting to move up. (See attached daily chart). This was telling me that if price was in fact able to come test the significant support in the 80.31 - 79.64 TS # Zone that I believed needed testing before any significant move up could occur, the MACD on the daily chart was confirming that it could potentially be a swing low.

Now we have talked before about how indicators are lagging and price is leading. In effect, price leads the indicator. That when price and the indicator are going in the opposite direction we can say that they are diverging. When the indicator is moving up and price is moving down we have the indicator positively diverging from price. When this occurs something has to give. Either the indicator has to move down and get in line with price or price will have to move up and get in line with the indicator. Indicator and price cannot diverge forever.
Additionally we know that the larger timeframes rule. In other words to determine trend we start top down and look at monthly, weekly, daily, hourly, 30 min, and then go on to whatever smaller timeframes we like to identify.
If the fast line on the monthly MACD is surging down it is not going to turn up until the fast line on the weekly MACD turns up, and the fast line on the weekly MACD is not going to turn up until the fast line on the daily MACD turns up, etc. The smaller time frame chart has to turn first to turn the larger chart.
So when do we get powerful trending moves? When the smaller timeframe MACDs are inline with the larger timeframe MACDs.
For intraday trading I am always aware of the 30 and 60 min MACDs. I consider those the larger timeframes for intraday. Of course in the back of my mind I know what the monthly, weekly, and daily are doing. As I mentioned at the start I generally I like to be trading in the same direction that the 30/60 min fast line is moving. So if the 30 and 60 min fast line is surging up for the most part I want to be long or looking for longs. When the smallest time frame fast line (5 min and under) is inline with the 30/60 fast line I don't want to be fighting that momentum. Normally the only time I will start looking for shorts when the 30/60 min MACD is moving up is if the smaller time frame that I am monitoring for entries is telling me something contrary to what the 30/60 min is doing. Remember the smaller time frame turning first is an indication that the larger timeframe could potentially be getting ready to turn.
On the daily oil chart (CL) we had a MACD fast line that started moving up after the June 4th first low before the price turned up (positive divergence). When price on the daily made a new low into the 80.31 - 79.64 TS # Zone on June 21 we had more extreme positive divergence. On Thursday June 28th we made an ominous close near the low of the session with a statement red candle. However the MACD on the 30/60 min chart started turning up Thursday night (see attached 60 min chart). The fast line was surging higher throughout the Asian, European, and US Sessions on Friday June 29, 2012.
The 30/60 min MACD fast line in line with the daily positive divergence was enough to turn this chart and send oil up to close with a 9.36% gain on the day. One of its biggest one day percentage gains ever. Sure the move was attributed to the news out of Europe but the technicals of this trade were setting up well before.
Disclaimer: I wish I could say that I captured the move up off the lows in Friday's session but Thursday's candle wasn't exactly a ringing endorsement for bulls and I went into Friday's session with the intention of looking for shorts into the 79.82 TS # and start of Range Short Zone from the Contract Notes.
When the move up started Thursday night I built a fairly nice short position around the 79.82 TS # and took first scale into the 79.45 TS # but ultimately we couldn't get back under the 79.45 TS # and hold. Since the line in the sand for Friday's session was the 79.09 TS # I knew that shorts needed it under and holding that landmark to get any legs to the downside. I was fine shorting higher into 79.82 TS # (significant resistance) with the anticipation that the move could be reversed into the London open (see 60 min chart attached) and by the US Open we could be back under 79.09 and I would have a nice cost basis to enjoy the ride lower.
However that is not what happened and oil, along with everything else except bonds, rocketed up nonstop into the US close on Friday.
The key things to take away from Friday's move was we were already over Friday's 79.09 line in the sand from the Contract Notes, CL then cleared the 80.31 TS # and top of KEY 80.31 - 79.64 TS # Zone so any intraday bias had to be to the upside, the daily MACD had positive divergence signaling up, and the 30/60 min MACD had turned back up. The announcement out of Europe was the match that lit the fire.
I expect some great opportunities in oil, along with other markets, this week. Even on the slow days the opportunities in oil are bountiful. If you would like to come trade with us there is a special offer below...see you on the other side!
Save 33% On Your First Quarter of TS Premium & TS Trades
Trade smart and trade well,
Tony Edwards