
Each Week Lo ngleaftrading.com will be providing us a chart of the week as analyzed by a member of their team. We hope that you enjoy and learn from this new feature.
Weekly Gold Report (January 28th through Feb 1st)
If anyone is trading any markets outside of Gold, you may be interested in knowing that this week is packed full of important reports in the United States, including a continuation of earnings reports, GDP, Payrolls, ISM, and even an FOMC announcement. There will also be Consumer Confidence Reports in the US and in Europe in this week’s reports, but if this week is anything like the last, the reports will pale in comparison to the importance of the technical analysis seen in the chart below.
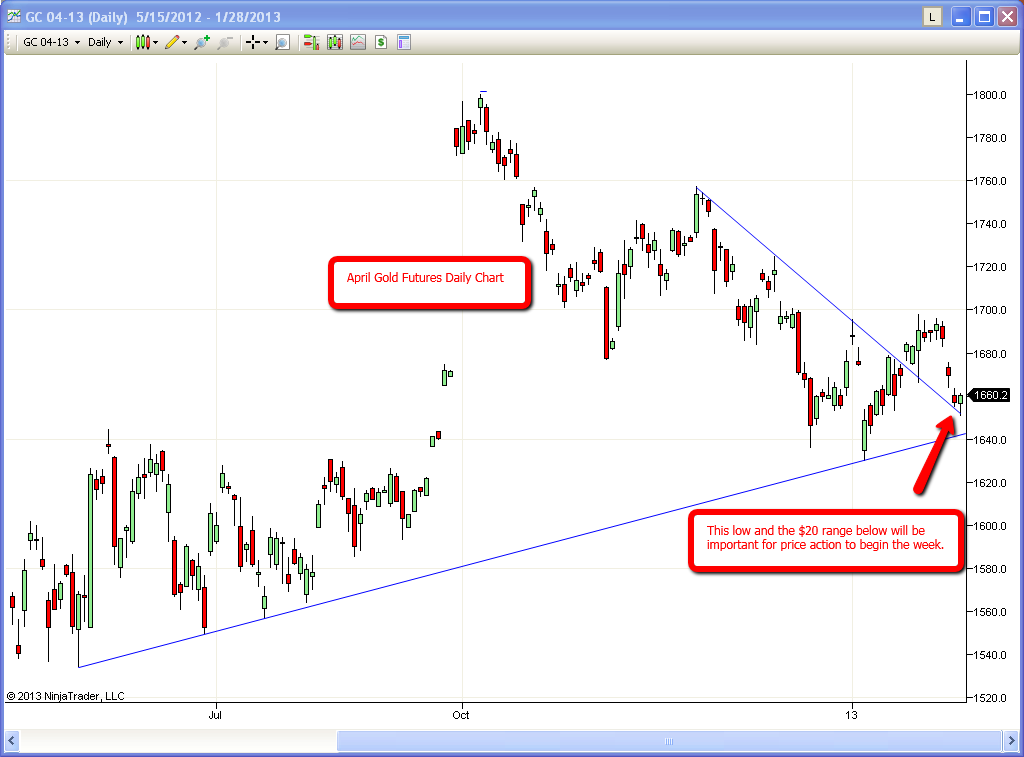
After a ten trading day, $70 rally in the Gold Futures, prices failed again to break $1700 four days in a row. That technical failure was just what was needed to drop the market on its head and now we begin the week at trendline support.
I am yet to find any reasonable explanation for the reversal in the Metals other than technical failure, option expiration, and one other story. There is speculation that the unwinding of the rally in the Metals is largely due to the fact that major funds were offsetting gains in the Metals to meet margin calls triggered by the huge selloff in AAPL. I saw a chart last week that put the APPL chart and Gold on the same page and it definitely looks like there is a correlation between the two.
So this week, instead of rattling off the results of reports and trying to anticipate the results we wait on this week, I will simply fall back on the technicals of the daily chart and recommend new positions based on support and resistance. For starters, it will be important to see how Gold holds up against the support pointed out in the chart below. This price and the $20 range below will be important for direction this week.
As always, feel free to call or email my office with any comments or questions regarding this report. I can be reached by email at [email protected] or by phone at (888) 272-6926. Good luck this week!
Thank you for your interest,
Brian Booth
Senior Market Strategist
[email protected]
888.272.6926
** There is a substantial risk of loss in trading futures and options. Past performance is not indicative of future results. The information and data contained in this article was obtained from sources considered reliable. Their accuracy or completeness is not guaranteed. Information provided in this article is not to be deemed as an offer or solicitation with respect to the sale or purchase of any securities or commodities. Any decision to purchase or sell as a result of the opinions expressed in this article will be the full responsibility of the person authorizing such transaction.
Hi Sarah. Thank you for the inquiry. We have a ton of data this week to weed through on top of the Earnings Schedule. With stock indexes this high, anything is possible up here. There is obviously a lot of interest in driving up stock prices.....and they may still have further upside but I am without a bias on stocks up here. If you notice, the S&P has gone very stale around 1500 ahead of the FOMC meeting. Whe I mentioned in the Gold article that I am trading technicals instead of fundamentals in Gold, i probably should have mentioned that I am trading only technically for every market at this point. That includes Currencies, Energies, Grains, Treasuries, etc.
agree that gold drop is related to aapl....longs getting clobberedin aapl and also taking profit in anything to get to cash.....we wil see....maybe eves shorts in NFLX or FB...lots od traders trade these buckets and may be whipsauded...also are stocks seen as better at his poinn.....or will we prabloic back to gold, silver and pms aftet this fallout...also include miners.