
We've asked our friend Jim Robinson of profittrading.com to provide his expert analysis of charts to our readers. Each week he'll be be analyzing a different chart using the Trade Triangles and his experience.
Today he is going to take a look at the technical picture of Datalink Corporation (NASDAQ_DTLK).
I hope you are having a GREAT week !!!
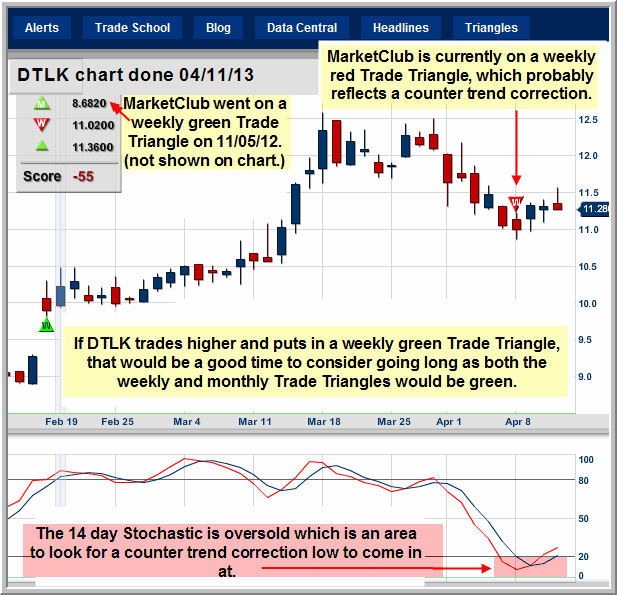
DTLK has set up a possible MarketClub Trade Triangle opportunity, so let's take a look at what is going on with DTLK in this week's Chart to Watch.
MarketClub put in a monthly green Trade Triangle on 11/05/12 and the monthly Trade Triangle is still green which means the longer term trend is still up as of right now..
DTLK is in a shorter term counter trend correction, which has turned the weekly MarketClub Trade Triangle to pointing down and red.
If DTLK trades higher from here, and the weekly Trade Triangle turns back to up and green, that will be a place to consider going long, as both weekly and monthly time frames (Trade Triangles) will both be green and pointing up.
Big things could possibly be in store for DTLK on the upside, which makes this a great Chart to Watch.
Thanks,
Jim Robinson
Profit Trading.com
Re: MLNX that you reviewed on March 29th:
The weekly chart made a "white doji" bottom on Jan. 25, a strong bottom signal. The daily DMI is very strong. And, if it closes on the weekly chart above the "shooting star" tail (65.77 made on March 15), MLNX will be going to the moon.
Thanks, Alan
These trade triangles are not a very good way to trade. Not nimble enough. See your report on March 22nd re: FSYS. While you gushed about a "great call" , the stock turned right around the very next day. Learn what your candle sticks are telling you. The very next day, the chart made a " dark cloud" and you would know then that the stock was headed down and you could go look for a better opportunity. In addition, that very week 3/22, the weekly chart made a "white doji" a strong top indicator on the weekly chart. RE: DTLK The daily chart made a "dark cloud" top on 3/19 and the weekly chart on 3/29 has made the same candlestick pattern that "F" made in April '08 when it went from $8.00 to $1.00. I recommend learning your candlestick patterns and you can turn on a dime instead of the "slippage" that is inherent in these Triangles.
I subscribe to MarketClub because I can scan through a lot of charts in a short amount of time. I don't pay attention to the triangles because I know the candlesticks.
Thanks, Alan
How do you set an alert for an email notification when the weekly triangle turns green?
MarketClub’s Alerts will allow you to set up email notifications of changing market conditions. These customizable “warnings” will monitor your portfolio and email you when certain market criteria have been met. It’s up to each member to decide how the Alerts will best fit their trading style and how often they want to receive them. Once you are on the Alerts page, follow these steps to set your Alerts:
1) Set Scan Type : You can receive alerts for 18 different market conditions that are detected by our Smart Scan technology. Use the pull down menu to select the type of alert you would like to receive.
2) Symbol To Watch : Choose to monitor your entire portfolio for various market conditions, or specify any symbol in your portfolio. Only symbols found in your MarketClub portfolios are available for the Alert feature.
3) Send Alert As Often As : Use this pull down menu to decide how often you are reminded that a specific market condition has been met. Choosing short term time frames will not affect how quickly we scan for market conditions, but only how often you are notified.
Best,
Jeremy
This is my 1st time reading about the trade triangles. I have not used them as yet and am looking forward to learning this technique.
Thanks,
Ruth