
Each Week Lo ngleaftrading.com will be providing us a chart of the week as analyzed by a member of their team. We hope that you enjoy and learn from this new feature.
Weekly Gold Report (July 8th through July 12th)
As expected, markets overall went through the lighter volume volatility trade last week due to the July 4th Holiday. The only standout was the Crude Oil Futures, which spent the entire week pricing in the news in Egypt. Aside from that, most other markets went through the usual rangy market swings that are expected around shortened Holiday weeks, especially those in the Summer.
I anticipate we will see similar movement in the week ahead as Summer trading continues. Additionally, the upcoming week is a bit light on tradable news. Aside from reviews from the monthly meetings of the Central Banks in the US and Japan, we begin quarterly earnings reports in the US Stock Indexes. If there are no major surprises, I would expect the same type of volatility we saw in the prior week.
Front month Gold Futures saw similar volatility last week on lighter volume. Until Fridays selloff, the futures did very little to entice traders to commit in either direction. The daily chart points out a small wedge pattern forming over the last two weeks, but the trend continues to be lower. The resistance trendline, identified by arrow #1 gave traders very nice technical prices to sell from, but until Friday the rewards were not all that exciting for those who took the risk.
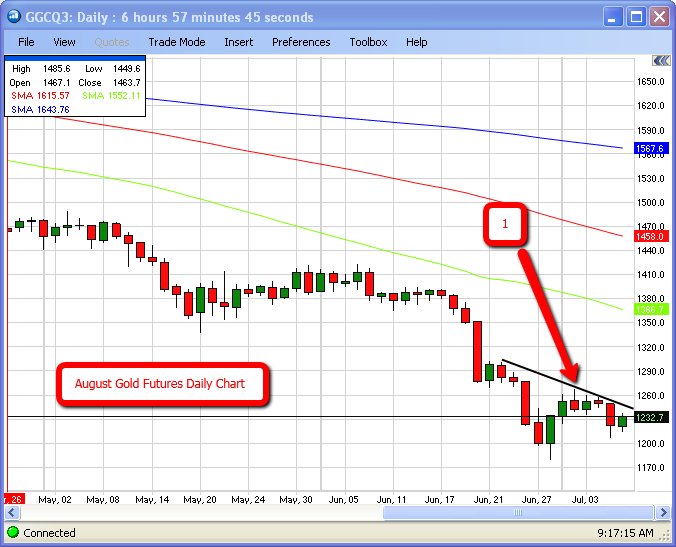
I will be using the same trendline this week as an indicator for a short position until the chart suggest something otherwise. With all the focus being on the stock market indexes this week again, it will probably take a very big move lower in stocks to entice buying in the Gold Futures. I do not see that happening this week, so I will likely continue to recommend short positions with stop orders to mitigate risk. Until the Gold Futures begin to show confident closes higher on a regular basis, we will continue to see selling pressure. It is said that typical bear market trends in Gold last over 100 weeks. If history repeats itself, the Gold has at least another two months of trending to go.
If you have any questions, please feel free to reach out to me directly. I can be reached via email at bb****@lo*************.com or by phone at (888) 272-6926.
Thank you for your interest,
Brian Booth
Senior Market Strategist
bb****@lo*************.com
888.272.6926
** There is a substantial risk of loss in trading futures and options. Past performance is not indicative of future results. The information and data contained in this article was obtained from sources considered reliable. Their accuracy or completeness is not guaranteed. Information provided in this article is not to be deemed as an offer or solicitation with respect to the sale or purchase of any securities or commodities. Any decision to purchase or sell as a result of the opinions expressed in this article will be the full responsibility of the person authorizing such transaction.
I don't see the Gold breaking the Resistance Line; I'll be short for a while.-