
We've asked our friend Jim Robinson of profittrading.com to provide his expert analysis of charts to our readers. Each week he'll be analyzing a different chart using the Trade Triangles and his experience.
Today he is going to take a look at the technical picture of the Facebook (NASDAQ:FB).
I hope you are having a GREAT week !
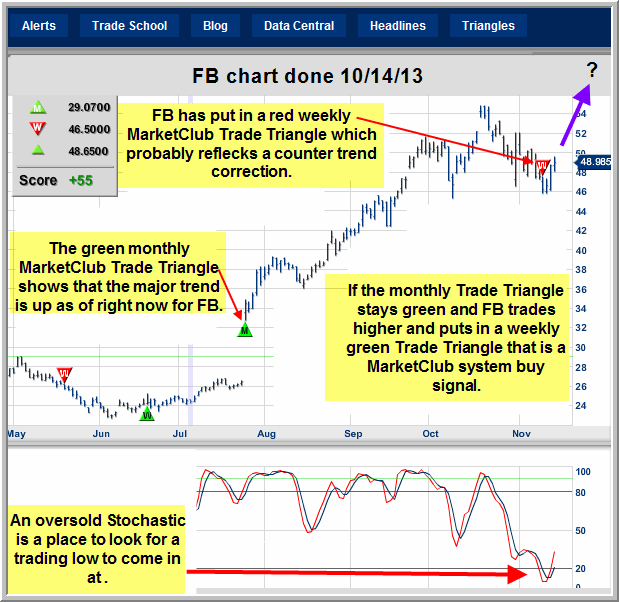
When trading stocks with the MarketClub system we use the monthly MarketClub Trade Triangle to tell the trend and the weekly MarketClub Trade Triangle to time the entry and exit points.
Facebook (NASDAQ:FB) is currently on a green monthly Trade Triangle which means the longer term trend is up.
Facebook is on a weekly red Trade Triangle which means it is probably making a counter trend correction.
If Facebook trades higher and puts in a weekly green Trade Triangle and MarketClub stays on a monthly green Trade Triangle that is buy signal with the MarketClub System.
If it does put in a buy signal from here, the stop on the trade would be if Facebook (NASDAQ:FB) traded lower after the buy signal and put in a red weekly Trade Triangle.
Facebook (NASDAQ:FB) looks to have a lot of upside potential which makes it a top Chart to Watch right now !
Thanks,
Jim Robinson
Profit Trading.com