
Each Week Longleaftrading.com will be providing us a chart of the week as analyzed by a member of their team. We hope that you enjoy and learn from this new feature.
Further Downside Expected as Gold Finally Chooses Its Direction
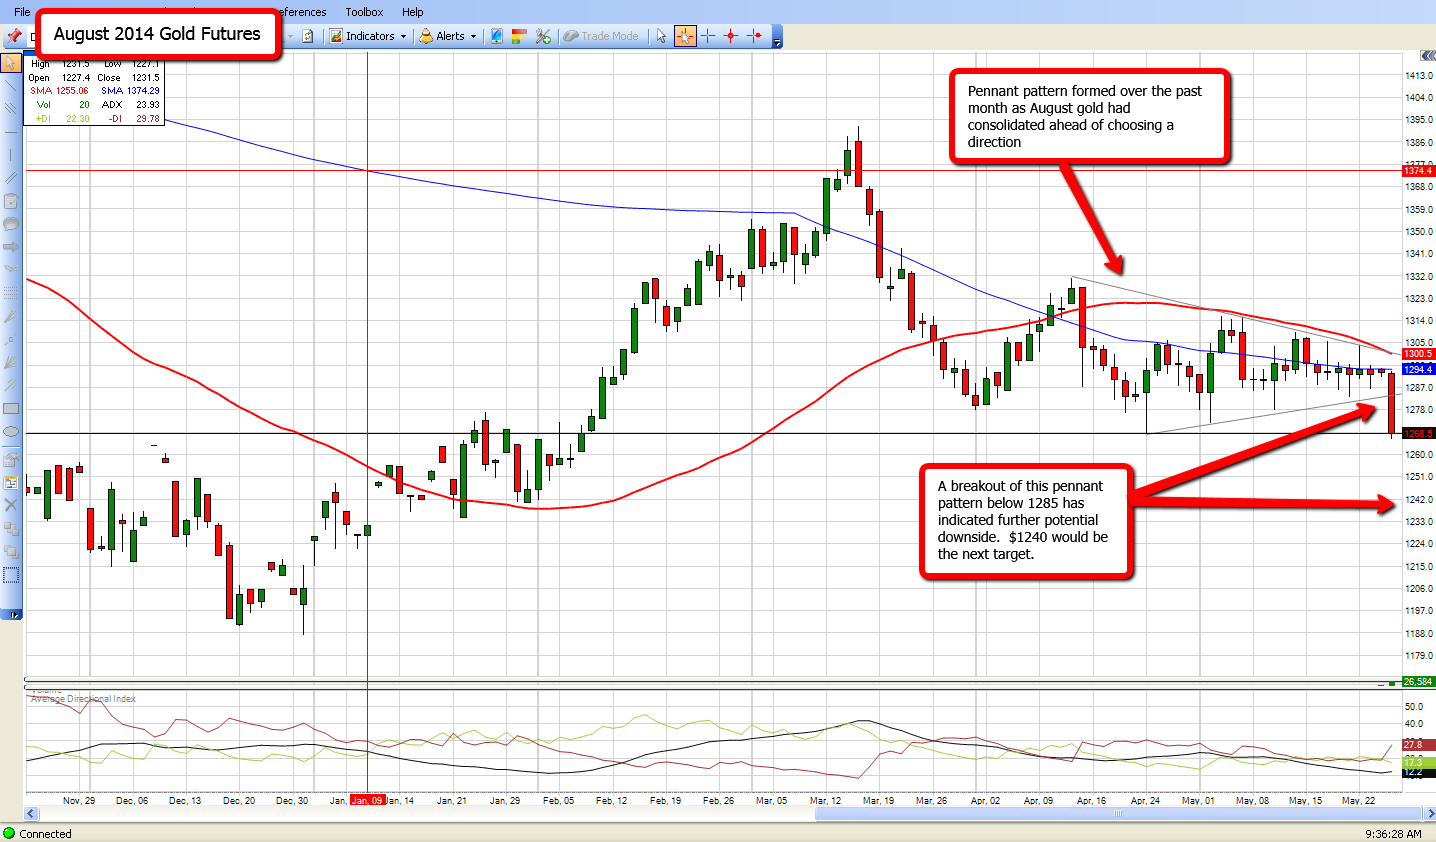
This week's market focus turns to August Gold futures, where a break out of recent consolidation may have finally determined the near term direction of Gold. The week starts out extremely bearish for Gold as the stock market continues to establish new all-time high levels. Recent economic numbers that have missed the mark have provided additional confidence to stock market investors that FED support will continue in the stock market. Optimism that stocks can continue their higher track has taken away from the safe haven appeal of gold.
Over the past month, August Gold futures have consolidated into a very tight range as the market has been deciding on its future direction. As of this morning the direction looks to be a sell off for the foreseeable future. With a break of the recent pennant pattern at $1285, the next downside target will be $1240. A close below $1280 in today’s session would confirm a further potential downside move over the coming months.
To take advantage of this downside continuation, I would look to purchase August put option strategies in gold that would take advantage of the next potential continuation move to $1240, while allowing roughly 2 months for the strategy to work. These strategies would expire on July 28th. Per strategy used, we would look to keep the maximum exposure in the market to $500 and the maximum profit potential to $2,500.
I advise clients on trading futures and futures options markets on a day to day basis. If you have any questions regarding this chart or questions regarding trading futures and futures options, feel free to call me directly at 888-272-6926.
Thank you for your interest,
James Leeney
Account Executive
Phone: (888) 272-6926
www.longleaftrading.com
** There is a substantial risk of loss in trading futures and options. Past performance is not indicative of future results. The information and data contained in this article was obtained from sources considered reliable. Their accuracy or completeness is not guaranteed. Information provided in this article is not to be deemed as an offer or solicitation with respect to the sale or purchase of any securities or commodities. Any decision to purchase or sell as a result of the opinions expressed in this article will be the full responsibility of the person authorizing such transaction.
Just 3 days later of my above post, Gold Dropped around to $ 1253 , now final support stood at around $ 1250 to 1240 and final hope will be between at around $ 1165 and 1135, if Gold fails to get support at all these important as well crucial juncture, then and then don't surprise even to found next down levels of around $935...... YES THERE WILL BE A 3 DIGIT QUOTATION FOR GOLD and that will too, in a much faster pace, IN A PANIC MODE
That was not required to wait till lower break-out or up to at current juncture for predicting weakness of Gold because, Gold already become "Confirmed Bearish" even on long term perspectives since breaking $-1850 mark, further all rest movements are just and pure natural or Technical, or like in accordance with normal up-down behavior, so finally, Long Term Trend of Gold is tell us.........
Gold was Bearish, is bearish, and will remain bearish till touching $800 or even lower levels.............this thing i am repeating Since beginning of bearish trend from $ 1850.
..........................and therefore, i am again one more time warn you that current market of around $ 1265 is also seems high, and any optimism hope or willingness to find some miracle will prove a great great foolishness, and you may will bound to pay the heavy cost for your wrong calculation or emotions..