Gold Update: Hard Top or Glass Ceiling?

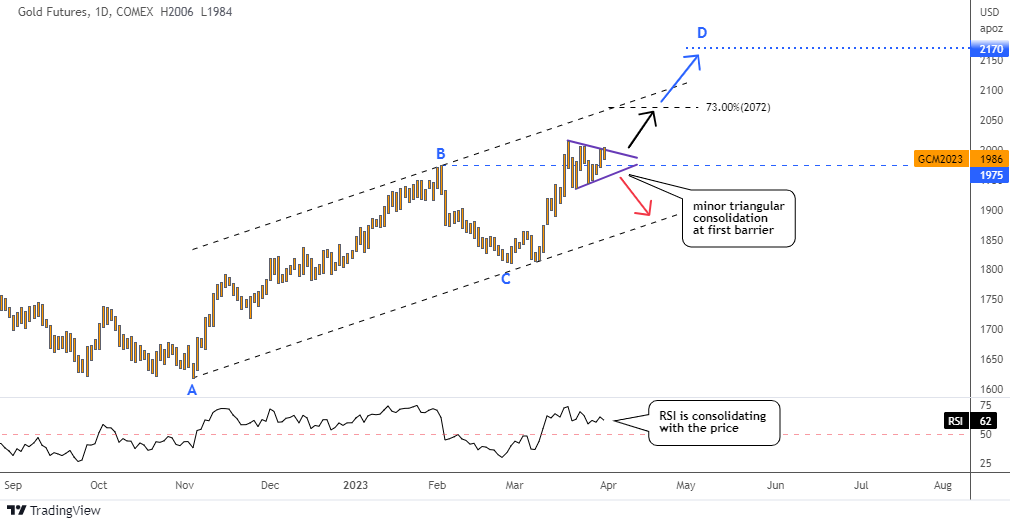
Gold price came very close to hitting the double barrier at $2,070-$2,100 of the black path target and the upper boundary of the bullish trend channel outlined earlier this month. The new 1-year top has been established at $2,063.

You were amazingly accurate this time as most of the votes were for the black path to lead the way. The market has since reversed to the downside, raising the question of whether it was a hard top or a glass ceiling.

To answer this question, let me show you an updated chart below.

Gold Futures Daily

Source: TradingView

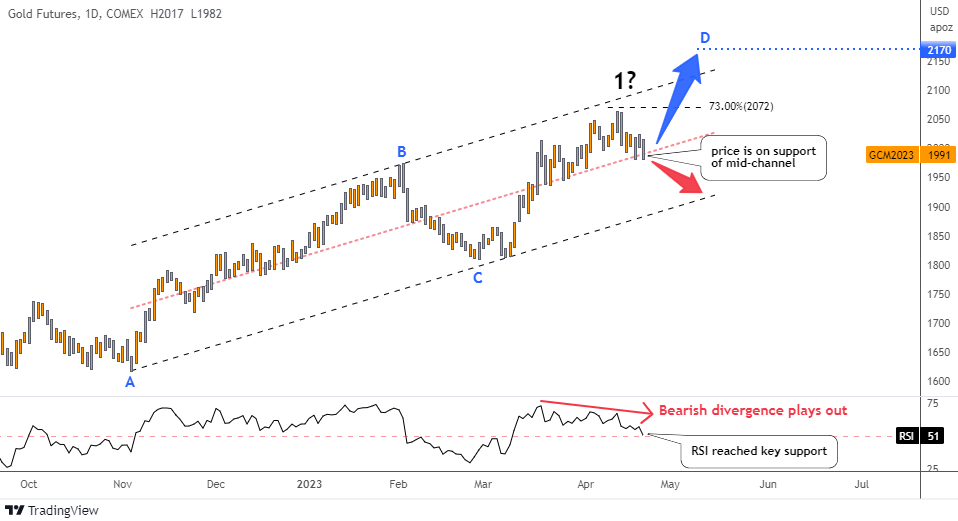
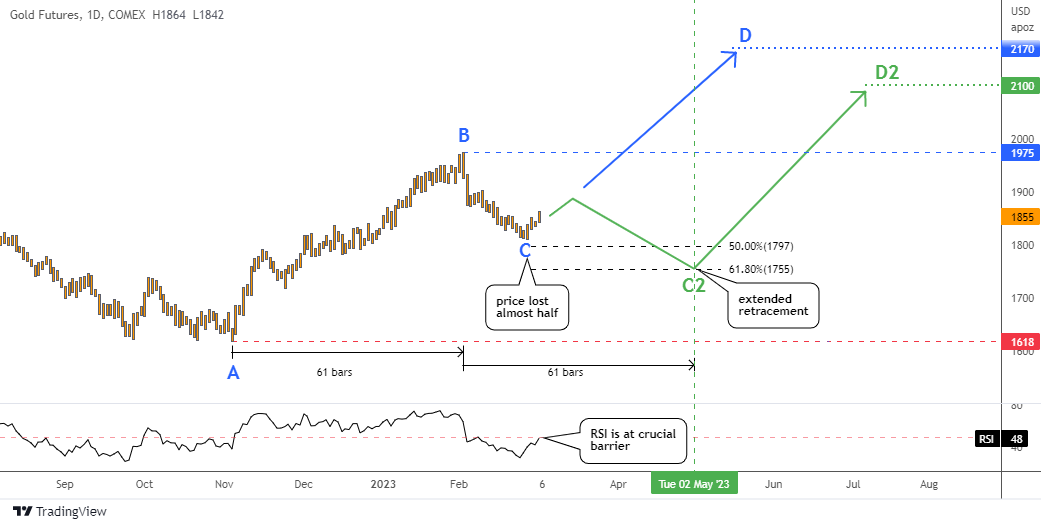
The price has slid down to the pink mid-channel support within the black bullish trend channel.

In the RSI sub-chart, we can clearly spot a bearish divergence as the falling peaks didn't confirm the new top in the price chart. This has been playing out, pushing the price down. The indicator's reading has reached the key support of 50, just like the price. Continue reading "Gold Update: Hard Top or Glass Ceiling?"

Gold And Tesla: Bulls Check Barriers

Last month, I presented three potential scenarios for the future price of gold in an earlier Gold Update.

In the poll, most of you chose the green path, which suggested an extended period of consolidation for the yellow metal. However, it appears that the blue (straight bullish) and black (similar to the pattern observed in 2017) paths are more accurate, as the green path is no longer viable.

Gold Futures Daily

Source: TradingView

In just two weeks since the last update, the price of gold futures has increased by $160 or nearly 9%, reaching a high of $2,015 on March 20th. This surge in price caused the previous top at the blue B point of $1,975 to be broken, but the price has since been consolidating around this level.

The price of gold futures has formed a triangle pattern (purple) characterized by falling peaks amid rising valleys. The size of the pattern is relatively small, and last week, the price attempted to break out of the pattern to the upside but was unsuccessful.

As a result, the upside potential of the move may be limited due to the small amplitude of the pattern. Continue reading "Gold And Tesla: Bulls Check Barriers"

Gold Update: Is Half Enough?

Since my last major update in November, the gold futures price has increased by almost 12%. At that time, most readers had chosen the bullish target of $2,089, where the price would retest the all-time high.

The gold futures chart is due for an update as it has reached a significant point in the current retracement following its recent peak at $1,975.

Gold Futures Daily

Source: TradingView

The gold futures price had been steadily rising for three months from the start of November until the beginning of February, where it reached a top of $1,975.

However, the market was hit when the “Jobs Report Dropped A Bombshell On The Markets”, which caused a significant drop in the value of many assets, including gold.

The recent price action in gold futures has been notable, marked by a sudden drop of $100 at the beginning followed by a slower decline in pace as the price retraced almost 50% and hit $1,811 by the end of February.

The question is whether this loss of half of the preceding rally is enough to consider the current bounce as a reversal. Continue reading "Gold Update: Is Half Enough?"

A New Bull Market In Gold?

We continue to think precious metals are one of the best risk vs. reward opportunities right now.

Last week, we shared the Gold to $5K Report with you from our friends over at All Star Charts.

You can check it out here, in case you missed it. The report outlines all of the reasons why Gold could hit $5,000/oz. sooner than the crowd expects.

Today we want to reiterate that it's not just Gold that looks attractive here. Silver is also poised to move higher.

Gold and Silver Futures Chart

As you can see above, Gold & Silver are confirming one another by hitting 6-month highs together.

The current leg higher began a couple of months ago after both metals formed a failed breakdown at support. As you might know, failed breakdowns often lead to fast moves higher, and we're starting to see that play out.

Silver Futures Chart

When you zoom out and look at a long-term chart of Silver, you'll notice it's in the process of forming a massive Cup & Handle pattern that dates back to 1980.

The next long-term objective for Silver is around $50, which is the all-time highs from 1980/2011. That's more than 100% higher here!

Be sure to download this free report to learn how to profit from this potentially historic move.

Enjoy,
The INO.com Team

Golden Pattern For Silver, Not Gold

Silver futures continue to maintain leadership not only among metals, but compared to all futures as we can see in the leaderboard below.

MTD Relative Performance

Chart courtesy of finviz.com

The white metal has seen gains of close to ten percent month-to-date. None of the metals come close as copper futures, formerly the number two, has lost its shine lately as I shared the reason last week. When compared to silver futures, gold futures appear pale with gains of 2.62%.   

All last week, I observed a pattern in the making, watching to see when it would trigger. As a result, exactly at the end of last week, the expected event happened. Here is a visual representation in the daily chart below.

Silver Futures Daily Golden Cross

Source: TradingView

There are two simple moving averages in the silver daily chart above. The blue line represents a 50-day moving average and the red one is a 200-day moving average. We can see that last week the short-term blue line crossed above the long-term red line. This pattern is called a “Golden Cross”. It is a bullish sign as it indicates a change in the trend to the upside. Continue reading "Golden Pattern For Silver, Not Gold"