

Foreword
The Dollar Index hit a very important psychological level at $100 on Thursday and closed the week above it despite weaker than expected US economic data.
This level hasn't been seen for 12 years. At that time, Gold was at $350-400 level, and Silver was at $5 level. It means that metals prices grew dramatically compared to the Dollar. With the Fed's "guess when I'll lift the rate" game, the Dollar will continue to be in high demand for the foreseeable future. It will put hard pressure on most of the currencies and commodities, including metals. Crude oil already fell prey to the Dollar, approaching a 6-year low below $50. Their negative correlation is very obvious: the higher the Dollar, the lower Crude Oil moves.
Precious metals struggle to keep the current status quo, building sideways patterns on the chart. This Dollar chart shows you the 360° view of the dollar-denominated market.
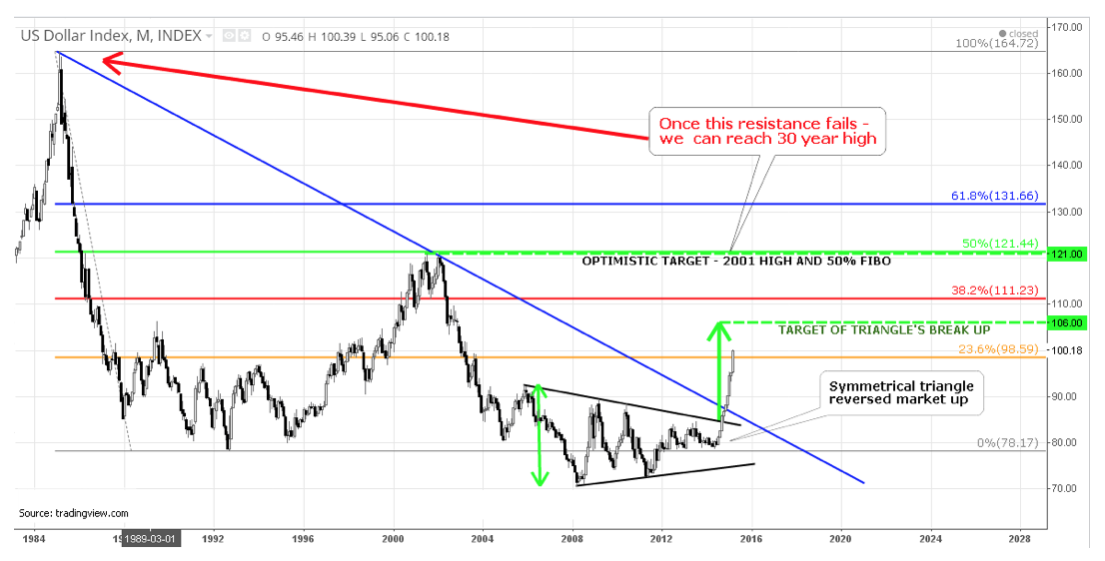
On the above Dollar Index chart, I illustrated where we are and what we should expect. The index did a vertical take-off, just after violating the symmetrical triangle's upside. The target for breakup is at the $106 level. A 23.6% Fibonacci retracement has already been overcome at $98.59. Such a robust ascent draws my attention to the previous peaks at $121 and even $160 level. These levels could be targeted, as a lift to zero interest rates, and an improving US job market are much more favorable compared to the negative and falling interest rates for the rest of the world. And as a seasoned trader, I would suggest to just play with the trend.
Gold
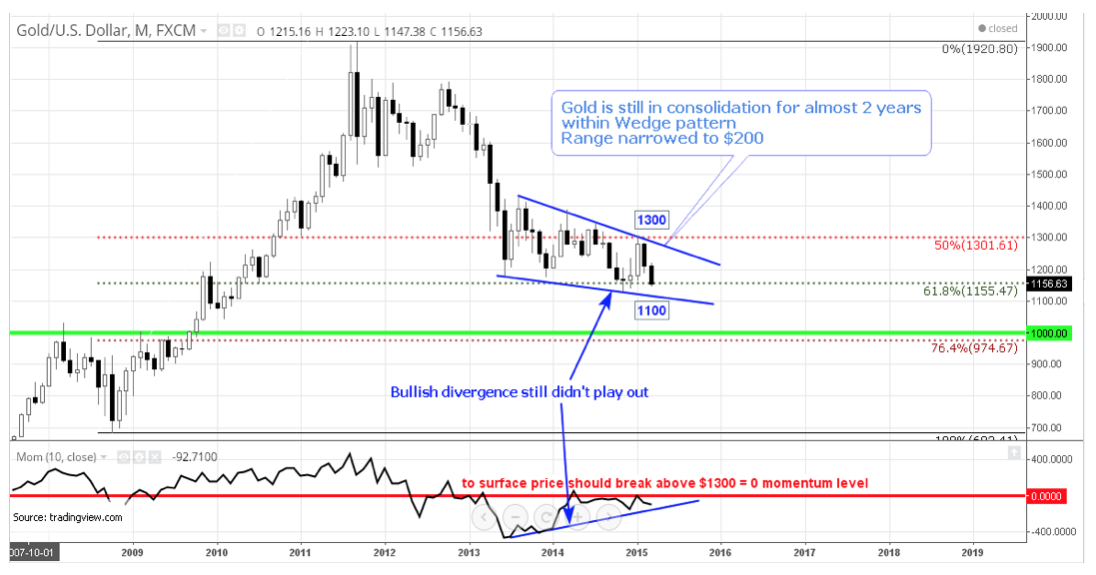
As seen on the above monthly chart, Gold ended the week on bearish note, but still managed to close above the 61.8% Fibonacci retracement level. Both last November and December dipped below this level but couldn't close there. Most of the days in March the price was hesitant with rare downside breakouts.
Long term traders are in a pause, as the market is still directionless even amid the Dollar's robust bullish trend. For almost 2 years the price is trying our patience within the Wedge pattern highlighted in blue. Finally, the range narrowed to $200 which means that we are approaching breakout stage.
Momentum has made higher lows and at the same time the price has charted lower lows, and that's called Bullish divergence. As I said in earlier posts divergence is not so powerful, but it's more like an early indicator of market imbalance which should be fixed by an opposite market move in an undefined future (already four months elapsed with divergence).
You should watch closely for a break of both the $1100 level on the downside (at the end of 2009 price stopped for a few months there) and the $1300 level on the upside (both previous high and 50% Fibonacci level are there) for clear long-term trading signal.
I think Bulls will try their luck and buy dips at the $1100 level to hold the price from falling to the magical $1000 level because the risk/reward ratio is very sound, $100 of possible loss versus at least $200 of possible gain, ratio is 1:2.
And again, I do believe that the $1000 level will not be done from the first and even from the second attempt.
Silver

Silver has a clear downtrend on the monthly chart. But nevertheless, the structure is multi-valued. On the one hand, the price is descending towards the downtrend, with the sideways stops highlighted in three orange boxes. On the other hand, the market is stuck to the upper side of a falling trend, with three consecutive reversal attempts. So far this month, Silver tried once to close above the trend, passing $16.5. It failed and lost more than $1 by the end of last week.
This quarter, Silver is trapped inside of the $14 - $18.5 range (highlighted in 3rd orange box). As you have seen on the chart above, the price is losing its volatility compared to the previous two sideways periods (highlighted in 1st and 2nd orange box). It means that both the bulls and bears have accumulated enough power to encounter each other, and the result is a current draw around the $16 level.
As soon as either market force gains enough momentum to surpass the range bounds, you can enter a position with targets located at $9 on the downside and $21.5 on the upside.
And please don't forget to limit risk by putting in tight stops.
Lucky and Intelligent Trades,
Aibek Burabayev
INO.com Contributor, Metals
Disclosure: This contributor has no positions in any stocks mentioned in this article. This article is the opinion of the contributor themselves. The above is a matter of opinion provided for general information purposes only and is not intended as investment advice. This contributor is not receiving compensation (other than from INO.com) for their opinion.
Dear Aibek,
Congratulation for your perfect prediction, we found good as well faster bounce from recent bottom, and i think, up to April end, we may find same bounce in oil too.
Rasesh
Interesting time indeed. As market has habit of taking most of the people on one side, chew them up and spit out, there could be false breakout above 1300 and then down we go .... quite a possibility so lets watch
The problem with the USDX is that it does not account for inflation.
I"m not convinced that one can use 30 years of technical analysis as a basis for anything (except for maybe seasonality). The world HAS changed considerably. There are macro reasons why the dollar is > 100 today. And those reasons have nothing to do with any chart or historic tendency. The world's currencies, that is, the economies of the world as viewed through those economies' central banks, continue to languish. That's pretty much it. When 2-3 economies, with their own floating currencies, begin to strengthen we will see the dollar top and fall. Even with the coming interest rate hike.
Gold and silver? Mere adjuncts to the USD at this point. Only a global calamity will disrupt this inverted relationship at this point.
Dear Aibek,
For Gold, Every one's eyes focused and waiting to obtain lower break-out from prior Bottom of $ 1140, so movement, there after will be quite interesting, and we may found so many stops triggered around between $ 1145 to $ 1135 followed with more faster fall.
As per my personal view, after breaking $ 1140, there will be hard to find support at even $ 1000 too, because same bounce from that level is also anticipated, however, once, after breaking major supports, it is quite difficult to get any further correction from lower levels, so free fall down trend may continue up-to lower range of $ 940 to $ 760 and considering that probability, your presenly provided Risk- Reward ratio will required to be rearrange.