
This week, you may want to keep your eye on 2 stocks:
AliBaba Group Holding LTD (NYSE:BABA) and Under Armour (NYSE:UA)
Both of these stocks are in positive trends and have seen a recent pullback from their highs. Is this a good time to buy?
Let's start with the chart of AliBaba and go through the numbers.
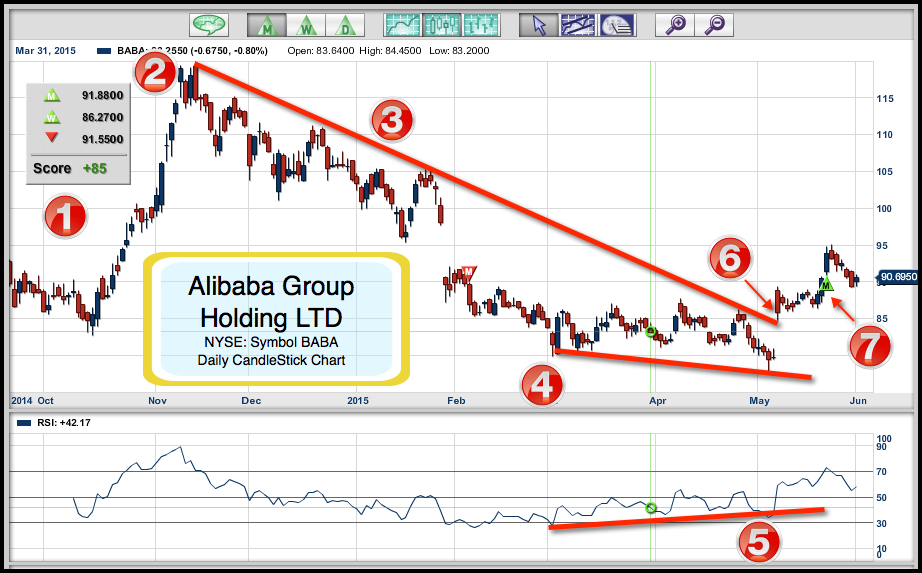
1. We have a +85 Trend Score as both the weekly and monthly Trade Triangles are positive, indicating a strong upward trend.
2. $120 is the all-time high for this stock and that was shortly after its initial IPO.
3. Major negative force trend line.
4.- 5. Positive divergence on the RSI line versus negative price action.
6. Breakout over the negative force trend line.
7. Trend change with the monthly Trade Triangle at $91.88.
Strategy:
I would use the current pullback in this stock to buy and go long. If and when the RSI level gets back down to 50, buy more.
Upside target zone for the stock: $100 to $105.
What could go wrong with this trade? Well, you could lose money, never a good thing. I will be using our red weekly Trade Triangle as a stop out point.
Alternate strategy: You might want to think about options for this stock. Learn about options here.
The next stock is Under Armour. Like AliBaba, the major trend on the monthly Trade Triangle is green, however the weekly Trade Triangle is red indicating you should be on the sidelines in this particular stock.
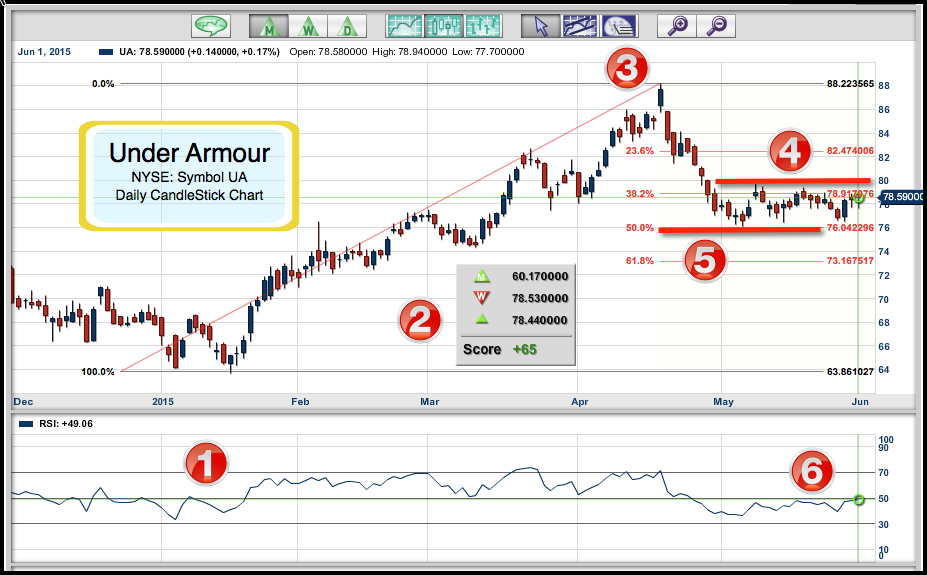
Now let's take a look at the numbers:
1. Notice how the RSI line is above 50 until the middle of April when it turns below 50 and the uptrend comes to a halt.
2. The +65 Trend Score indicates a trading range for this stock at the moment.
3. The Fibonacci retracement from the all-time high on this stock at $88.14 on April 20 to the low that occurred on January 16 at $63.77.
4. Resistance at $79.69. A move over this level turns the weekly Trade Triangle positive and gives a buy signal.
5. Support for Under Armour at the 50% Fibonacci retracement level of $76.04.
6. When the RSI closes over 50, it will be another indication that this stock wants to move higher.
Strategy: Buy this stock when it moves over $79.69. Should that happen, place stop below $76.00. You might also want to buy some options on this stock. Learn about options here.
Target zone: Should this stock give a buy signal, I would look for a retest of the $88 level and longer-term $100.
What could go wrong? There are many variables, but certainly a move below $76 after a green Trade Triangle would indicate that I was wrong in my analysis of the stock.
Thanks for reading and every success with your trading.
Every success with MarketClub,
Adam Hewison
President, INO.com
Co-Creator, MarketClub
I'm new to your program and don't understand the term RSI. I know it isn't the stock price, so when you say to "buy" how do I correlate that to the stock prices of UA and BABA? For example, when you say buy UA at $79.69 and place a Stop at $76 (about 5%) are these Stock prices? The same with BABA.
REDUCE COSTS...SELL PUTS IN BABA...TWO MONTHS OUT
OR
BUY BABA AND SELL COVERED CALLS (NEAR THE MONEY)...ONE MONTH OUT
RISK--THE MARKET