
If you follow our blog, then you are definitely familiar with trader Larry Levin, President of Trading Advantage LLC. We have gotten such a great response from some of his past posts that he has agreed to share one more of his favorite trading tips as a special treat to our viewers. Determining the direction of the market can be tricky and just plain confusing at times, but Larry’s expert opinion keeps it simple and straight-to-the-point.
If you like this article, Larry’s also agreed to give you free access to his award winning book.
Today he’s going to talk about knowing your way around a chart.
For most traders, charts are like their road maps to potential trades. Technicians see potential patterns, key clues that they interpret for trading opportunities. Fundamentalists see confirmation of news stories or supply and demand dynamics playing out in the price fluctuations. Charts are indispensable to traders
Understanding what a chart is telling you is paramount for traders
We are going to look at the two most common chart types, and the basics of their construction. The main thing to understand when you are looking at any given chart is that there is key info that shouldn't change. Each chart will be showing you prices on one axis and time periods on another. Most charts will show the prices on the vertical axis and time periods (e.g. daily, hourly, five minute) on the horizontal one, like this:
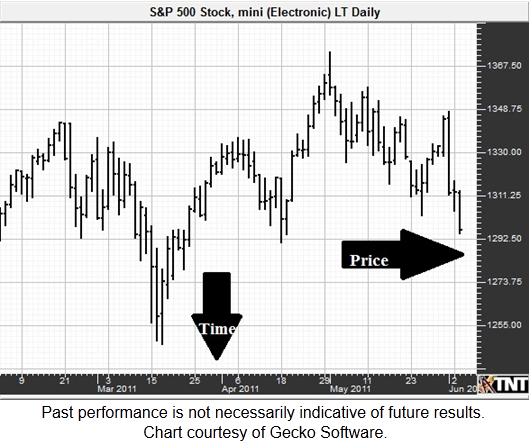
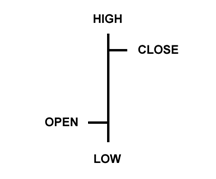
The filler in the middle of the chart made up of the price bars. Each mark corresponds to a trading period on the bottom and a price range on the right. On this chart, these are the little bars that show the opening price, the high price, the low price, and the closing price.
I tend to favor candlestick charts, which show the same information in a different way.
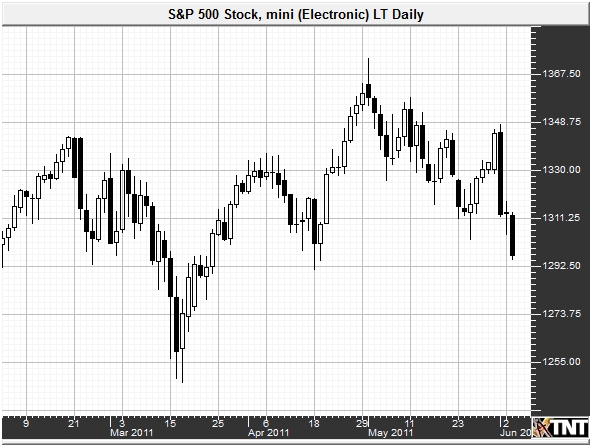
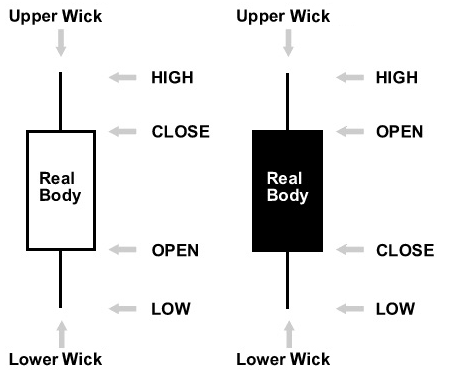
Each candlestick shows the opening price, closing price, session high price, and low price and the color of each candlestick can tell you at a glance if the market closed higher or lower than the open i.e. if it was a down day or an up day.
Whether a bar chart or candlestick chart, people who analyze charts (also known as technical analysis) are looking for clues to potential market direction. For them each new bar or candle can combine with one or several others to form patterns which they believe might forecast future price movements, or at the very least reveal possible trends.
Technical analysis involves looking for possible clues or patterns in charts
There are many different patterns that traders reading charts might be looking for. Some are simply patterns formed by the bars or candlesticks, others are more complex pattern which use other indicators. Let's take a look at some of the most basic:
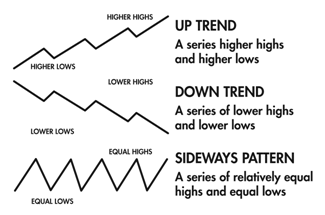
Sometimes, a chart that is showing a sideways pattern is said to be a in a channel. Every movement higher meets with overhead resistance where selling comes in. Each move lower brings in buyers which creates support.
Candlestick charts also have special patterns that have been identified and named over a long history, said to stretch back to rice traders in Japan. Many of these patterns have fantastic Japanese names like doji or harami. Others have names which describe what is taking place in the pattern like engulfing patterns where the body of one candlestick overtakes the other. These are explored in more advanced Trading Tips.
Recognizing certain patterns or trends can help when planning trades
Technical analysis is one of the backbones for trading strategies. If you can correctly identify a trend, you might be able to spot a trading opportunity. If you can recognize and understand support and resistance, you might be able to use them when planning exit strategies. One of the key things to remember is that the history of a market's price action is no promise of future trading activity. Just because it went to a certain price level before, doesn't necessarily mean prices will move the same way again. Analysis is fallible. Another word of caution for traders - be careful not to let personal bias overrule chart observations. Sometimes we are guilty of seeing patterns to fit our desired forecasts.
Click Here to gain access to Larry's award winning book.
Larry Levin
President & Founder- Trading Advantage
la***@tr**************.com
Disclaimer: Futures and options trading involves a substantial degree of risk and may not be suitable for all investors. Past performance is not necessarily indicative of future results. Secrets of Traders LLC provides only training and educational information. By accessing any Secrets of Traders or Trading Advantage content, you agree to be bound by the terms of service. Click Here to review the terms of service.
I want to thank Larry for letting me download his book. I'm sure it will help make me a better trader. And thank you very much, ino.com, for making it available to your subscribers.
Can MC consider offering their charts in logrithmic format in the near future please?