Knowing Your Way Around A Chart

If you follow our blog, then you are definitely familiar with trader Larry Levin, President of Trading Advantage LLC. We have gotten such a great response from some of his past posts that he has agreed to share one more of his favorite trading tips as a special treat to our viewers. Determining the direction of the market can be tricky and just plain confusing at times, but Larry’s expert opinion keeps it simple and straight-to-the-point.

If you like this article, Larry’s also agreed to give you free access to his award winning book.

Today he’s going to talk about knowing your way around a chart.

For most traders, charts are like their road maps to potential trades. Technicians see potential patterns, key clues that they interpret for trading opportunities. Fundamentalists see confirmation of news stories or supply and demand dynamics playing out in the price fluctuations. Charts are indispensable to traders

Understanding what a chart is telling you is paramount for traders

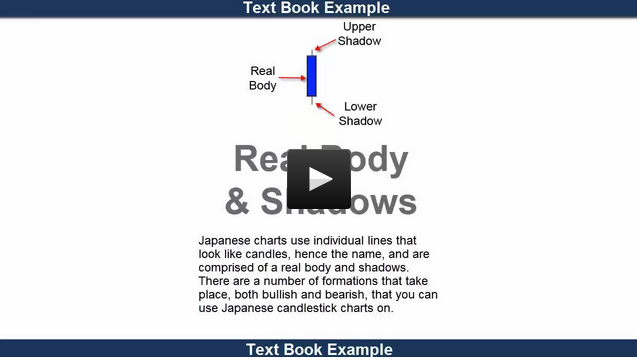
We are going to look at the two most common chart types, and the basics of their construction. The main thing to understand when you are looking at any given chart is that there is key info that shouldn't change. Each chart will be showing you prices on one axis and time periods on another. Most charts will show the prices on the vertical axis and time periods (e.g. daily, hourly, five minute) on the horizontal one, like this: Continue reading "Knowing Your Way Around A Chart"

Practical Applications of Candlestick Charts

This audio lecture along with the downloadable PDF workbook covers and discusses practical trading approaches, including stop placement and trailing levels, risk parameters, money management and the psychology of trading any market with Japanese Candlesticks. The information derived by using this approach can directly influence the day-to-day decision process, which can enhance your awareness of the markets. You will learn the basics of Japanese Candlestick charting, as well as how to combine them with Western technical tools such as trend lines, DeMark Sequential, moving averages, stochastics, and may other standard technical tools.

Developed over three hundred years ago, this method of technical analysis is still relevant and an exceptional addition to Western technical analysis. By combining both approaches to market forecasting, one is able to take the best from both schools. Gary Wagner believes that the outcome from this combination is capable of extending the benefits of any methodology.

LISTEN NOW: Practical Applications of Candlestick Charts

Best,
The INOTV Team

Understanding Candlestick Charts

Today, we're going to be looking at classic Japanese candlestick charts. Candlestick charts were first used in Japan over two centuries ago by rice traders to chart rice prices. This system of charting has been around for a long time and can be valuable to traders everywhere. Japanese candlestick charts are now widely available on the web and in most software packages.

Candlestick charting shows, in a very visual way, a powerful picture of what's going on in the markets. Candlestick charts use individual lines that look like candles, hence the name, and are comprised of a real body and shadows. There are a number of formations that take place, both bullish and bearish, that can provide traders with valuable information.

I first discovered candlestick charting during a speaking engagement in the early 90s in Japan. Up until that time, I had used traditional Western bar charts and point and figure charts, which I also like. When I first saw a chart that had been drawn in candlesticks, I was immediately hooked, as I could see how candlestick charts show a visual image of what is going on in any market. In this tutorial on understanding candlestick charts, you will see some of the most powerful setups and learn all about the various candlestick formations and how you can use them successfully in various markets.

This short video shows you not only classic textbook examples, but also real world examples. I hope you find the video lesson interesting and of value to your own investment knowledge.

Every success using candlestick charts in the future,
Adam Hewison
President, INO.com
Co-Creator, MarketClub

Everything You Have Ever Wanted To Know About Candlestick Charts

In today's video, I will be talking about candlestick charts and just how powerful they are when they are used correctly. This form of charting began centuries ago in Japan, where rice merchants used candlestick charts to track the price of rice, a major commodity in that country.

Unlike Western charts, Japanese candlestick charts can have colorful names and modern interpretations can have colorful candlestick bodies to better highlight price movements. The candlesticks are normally made up of a "body" and an upper and lower "shadow" (or "wick").

Loading the player...

Today, I am offering my PDF booklet, "17 Money Making Candlestick Formations You Can Use Today In MarketClub."

If you don't already have a copy of this e-book that shows you all 17 major candlestick formations, give us a call at 1- 800-538-724, extension 106 or 410-867-2100, extension 106. You may also email [email protected].

Enjoy the video and put the power of candlestick charts to work for you today.

Every success and thanks for watching.

Adam Hewison
President, INO.com
Co-Creator, MarketClub

Does this one chart line spell doom for the markets?

Make no mistake about it, last week was a very important week for the stock market. Looking on the weekly equity charts, you will see one of the most powerful Japanese candlestick lines. This one line on the chart indicates that there could be some major problems ahead for the stock market.

In my new video I explain what this line is and how it can play out in the short and longer-term time frames.

As always our videos are free to watch and there is no need for registration. I would really like to get your feedback on this powerful formation and what you see for the markets ahead.

All the best,
Adam Hewison
President of INO.com
Co-creator of MarketClub