
Over the weekend I was analyzing the charts and it appeared to me that with Friday's red Trade Triangle on the S&P 500 that stocks have topped out. The similarity between August and September and this January and February is quite startling. If the same pattern holds true then the next big swing in the stock market will be to the downside.
Already we have seen weekly Trade Triangles in the NASDAQ (NASDAQ:COMP) and just recently in the S&P 500 (CME:SP500). These weekly red Trade Triangles many times act as early warning system and are a strong indicator to move to the sidelines in the case of the Indices.
I would not be surprised to see more back-and-forth choppy trading action before the market eventually falls under its own weight.
I am looking for stocks to make a cyclical low sometime in June if the same cycle holds true.
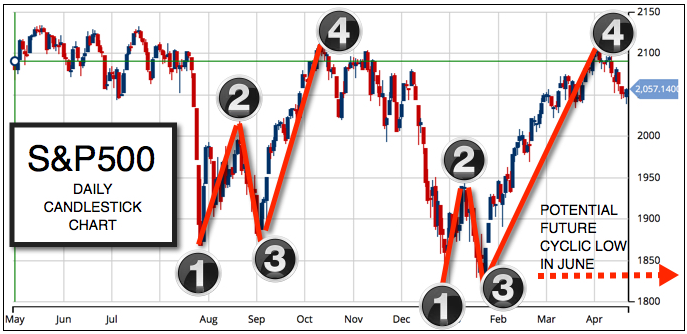
S&P 500 Chart Legend
1. First Low
2. Pivot Point
3. Second Low
4. Cyclic High
Future Cyclic Low
The only stock index that is holding up at the moment is the DOW (INDEX:DJI) with support coming in at 17,580. Should that level be broken this week it would indicate that all three major indices according to the Trade Triangle and that they are officially in a trading range and intermediate term investors should be on the sidelines.
Before that happens I would not be surprised to see more two-way trading action before the market breaks to the downside.
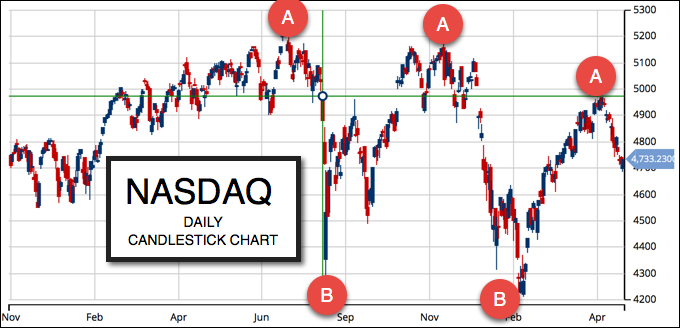
NASDAQ Chart Legend
A. Cyclic Highs
B. Cyclic Lows
It's going to be an interesting week so be sure to check the Trade Triangles as often as you can.
What do you think the markets will do? I would love to hear from you - if you have any questions or comments drop us a line. You can share which markets you're trading, which markets you're watching and how much you love MarketClub.
Stay focused and disciplined.
Every success with MarketClub,
Adam Hewison
President, INO.com
Co-Creator, MarketClub
eurusd bad today for me see me money
Lady and Gentleman,
Look like AGGRESSIVE 3rd Wave is about to Begin.
Hold your sea belt tightly
Have a Happy or a Sad weekend
GOODLUCK EVERYONE
For what it's worth, here's a few things to note:
1. I see a head-and-shoulders pattern emerging. Similar to last October thru December. To me, that indicates a downside move coming.
2. Volume is declining. The adage "sell in May and go away" seems to be appearing.
3. There needs to be a catalyst. Last summer it was China devaluing their currency and caused the dive. The January dive was due to falling oil. I can't forsee what's the catalyst this time ... oil, again? or maybe there will be some disappointing earnings announced in June? But once it takes hold, I think the dive will be similar to January, but less dramatic unless it's unexpected and unmanageable. If no catalyst, then I guess we could see a trading range emerge that'll be +/- 200 pts for a while.
Mike. I agree we are heading south and that we take out 1825 on the S&P 500 after meandering 1 or 2 weeks. See my comment below.
Catalysts:
Unexpected rate hike in June. GB leaves the Union and the euro tanks so the $USD goes up which markets usually don't like.
Gold tanks for the finally time before a big,big rally (the COT on gold going up is way over crowded) or Treasury auctions don't go well and the "markets" do the job of raising rates for the Fed, Italian Banks all of a sudden don't look too strong, China's bank loans for the "old China" stimulus for infrastructure are problematic as they switch to a consumer driven economy, etc.
The S&P 500 is priced to/for "perfection" and so it need not be a biggie to get the ball rolling this time. If you truly believe this is a massive H&S reversal pattern , the "pattern weenies" would say it should drop another 400 S&P points
below 1825 (the bottom of the neck line). Don't know when it will start, but trust me it. it will be big.
Stay tuned.
This market is priced to and for perfection. This catalyst need not be a biggie to get the ball rolling
TODAY WAS VERY INFORMATIVE I HAD PLAIN ON THE 10.00 PICKS I WAS HOPING TO GET THOSE PICKS IN FOR NEXT WEEK. THANK JASON YOUR A BIG HELP!
The S&P 500 seems to be making a bull flag in my opinion. If you go as far back as '84 and draw the trend, the S&P has printed an ascending triangle with an upside target of about 2600. Although I'm still new to trading, I am studying regularly and this is the current outcome I predict ! As of 4/13/16, we broke out to a new bull leg. Just my opinion. I would greatly appreciate any and all replies.
Hello Adam and Jeremy,
Can you include in your commentary Nat Gas, biotech, and energy....etfs IBB LABU CURE ERX XLE UGAZ GASL UNG...all seem basing off bottoms.
metals base industrial .and precious metals as well...seem to be ones to recover for 2016. XME DBC GDX GLD SLV etc
Hello Adam, Please add in your commentary Natural Gas and biotech(.IBB LABU CURE etfs) and in geneery ERX XLE...all seem to be coming odd bottoms and basing for 2016..thanks for gold and index updates.
Adam,
Being a "Pattern Wienie", I was surprised you did not mention that the pattern that I see forming is a "broadening top".
The first rebound was very swift and the points between the tops was decently quick. The bottoms of the first selloff were equal.
Then we had another rebound(not as steep as the first), followed by a gradual selloff culminating with two bottoms. But this time the last bottom was lower than the first bottom.
This was followed by an anemic rally which took a longer period of time to top out. From top to top, the second rally took longer than the first rally and the bottom "fork" was weaker in the second market.
As you know Adam, in a broadening top pattern, the third selloff is far more severe and longer than the second.
Stay tuned.
I'm a permabear; you guys are the ones making money.
Ultimately, follow price action. Watch key levels. Then take action on what price says.
From a probability point of view, the market is toppy and rolling over is the highest probability trade. I see no logic - other than a truly black swan event or a series of complementary events to the negative- that will take the market down 40% . Based on other pundits, the market at the end of the year will probably (again based on their analysis) close near the peaks of the past year.
So the net of this is that if you follow the chart patterns, we can see the cycle approaching the Feb lows or slightly below. To that end, buying puts or contra etfs to protect your portfolio makes sense. The issue is the amount of downside risk you want to bear (no pun intended) so as to keep the insurance premium low. Also in this market, high probability trades are covered calls on your portfolio stocks because they will not get exercised in a down market. Of course, selling all stocks and sitting on the sidelines is a good strategy as well. It depends on your time horizon and view of the future.
Good trading to all.
It seems that pessimism is ruling the roost. In early march this year the message of various blogs warned of a imminent roll- over of the DOW at about 17191.
Today the DOW closed at 17700, a difference of about 3.5%. When you go back to 2009, when the DOW started to recover we were told that this rise was only temporary. It could not last. Helicopter Ben was leading us on a path of destruction with inflation and unemployment rising. Well inflation is down and so is unemployment. Maybe you all should have a look at the DOW chart from as far back as 2009, then you will see a double bottom in about Oct 2015 and on Feb 2016 at about 15500 with a pivot point at 18000. I will leave it to the experts to figure out what the projected target could be using these figures. Maybe things are not as bad as the look, or we have become completely desensitised of bad news. Hope you will all have a happy and safe day. Konrad
would love to see the big correction take place!!
I think this week itself is crucial . Turn of events with compounding effects could trigger a major correction in a range 25-40% .
Given the key event/s with a significant impact on the world markets !
As you indicated that the weekly trade triangle turned red and that we should be out of the market.
Could one use the red weekly triangle also signal to go short with some puts on the indexes?
What markets?
Markets? They resemble a giant casino to me...