
Over the weekend I was analyzing the charts and it appeared to me that with Friday's red Trade Triangle on the S&P 500 that stocks have topped out. The similarity between August and September and this January and February is quite startling. If the same pattern holds true then the next big swing in the stock market will be to the downside.
Already we have seen weekly Trade Triangles in the NASDAQ (NASDAQ:COMP) and just recently in the S&P 500 (CME:SP500). These weekly red Trade Triangles many times act as early warning system and are a strong indicator to move to the sidelines in the case of the Indices.
I would not be surprised to see more back-and-forth choppy trading action before the market eventually falls under its own weight.
I am looking for stocks to make a cyclical low sometime in June if the same cycle holds true.
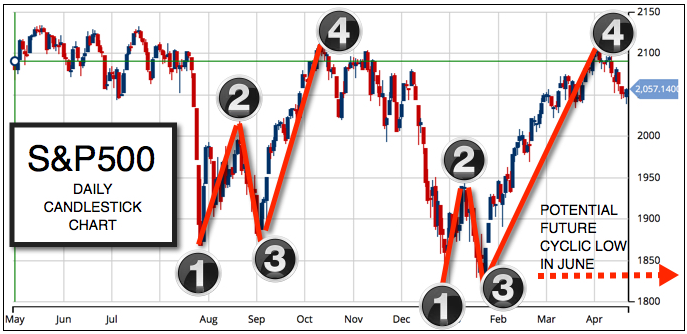
S&P 500 Chart Legend
1. First Low
2. Pivot Point
3. Second Low
4. Cyclic High
Continue reading "The Next Big Swing In Stocks"