
Every election year over the past five US Presidential election cycles has presented a unique set of price rotation events. Particularly evident in strongly contested US Presidential candidate battles where the voters are consumed with pre-election rhetoric. The 2007-08 election cycle was, in our opinion, very similar to the current market cycle in terms of consumer sentiment and economic function. The 2015-16 election cycle was less similar, yet still important for our researchers.
The economic conditions of the US economy and the global economy were vastly different prior to each US Presidential election cycle and continue to evolve throughout the current 2020 election cycle. Yet, our researchers believe the correlation of price volatility and rotation combined with the distraction for consumers as the election process occupies the hearts and minds of almost everyone across the globe takes a toll on the markets. Prior to almost any US Presidential, price volatility and trends tend to become much more exaggerated and extended.
We’ve published research articles about this technical setup/pattern that occurs in the markets nearly 8 to 15+ months before the US Presidential election cycle before. The basic theory of the setup/pattern is as follows…
- 12+ months prior to the election date, the parties consolidate around specific candidates where the first battles of the US presidential election cycle conclude.
- Over the next 12 months, the battle between the selected candidates becomes more heated and aggressive as voters are pushed information and disinformation related to their decisions.
- The process of the election and the decision-making process for consumers/voters is very stressful and distracts from the normal economic activity for many. This distraction translates into an indecisive market where future expectations (optimism and pessimism) greatly depend on the outcome of the election. Thus, the markets are stuck in a “no man’s land” type of “stasis” waiting for the election event to conclude.
Depending on the events that lead up to the election date, the stock market could be biased towards a bullish trend or a bearish trend which can have a big impact on the pre and post-election outcomes.
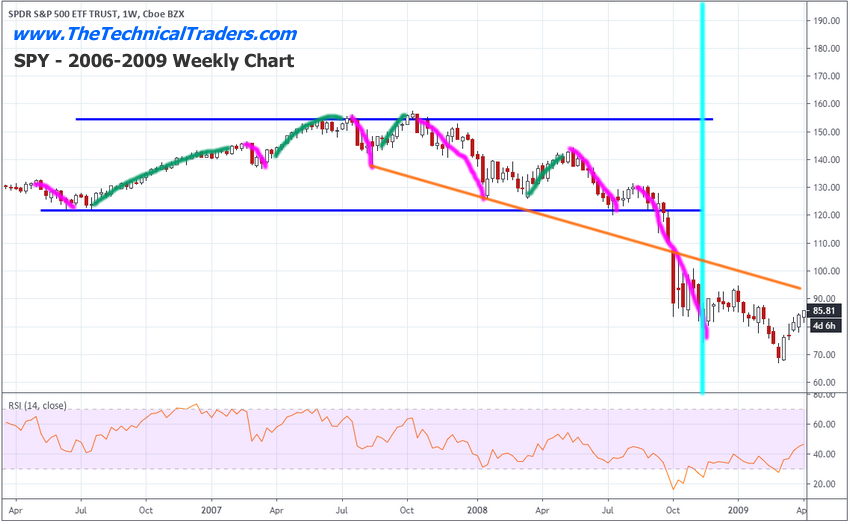
S&P 500 Index 2006-09 US Presidential Election Cycle
Let's start by taking a look at the 2006-09 (2008 US election cycle) data/chart. First, we can see the price trend in 2006-07 was moderately bullish within the early election cycle. The first real signs of a crisis in the markets took place in mid-2007 where a deep low price move setup a double-bottom. Near the end of 2007 and into very early 2008, the stock market collapsed below those lows and never really recovered. The real collapse in price began in June 2008 – after a moderate price recovery from the new lows. Price continued to collapse more aggressively just prior to the election date and even after the election was completed.
Yes, we know this collapse was related to the 2008-09 Housing/Credit market crisis and was not related to the directly related to the Presidential election event. Yet, we, as technicians, believe price translates all external factors into a form that we can use to derive future information from. The point we want to try to make is that election cycle years tend to be much more volatile and aggressive.
The pre-election price declines appear to set up a bottom or double-bottom price level 12 to 15+ months prior to the election date. After that completes, the markets may attempt to rally above previous highs at some point, but will likely attempt to retest recent lows 4 to 12 months prior to the election date. As voters/consumers’ attention is consumed by the election process, news and rhetoric, consumers change their habits and become more protective of their assets and future expenses.
The one thing to consider when reviewing this chart is that the uncertainty and indecision in the markets related to the Presidential election cycle were compounded by the collapse of the housing, financial, and credit markets. This event created additional price and economic concerns fairly early in 2008. Additionally, pay attention to the June 2008 change in price trend that sets up a deeper downside price collapse.
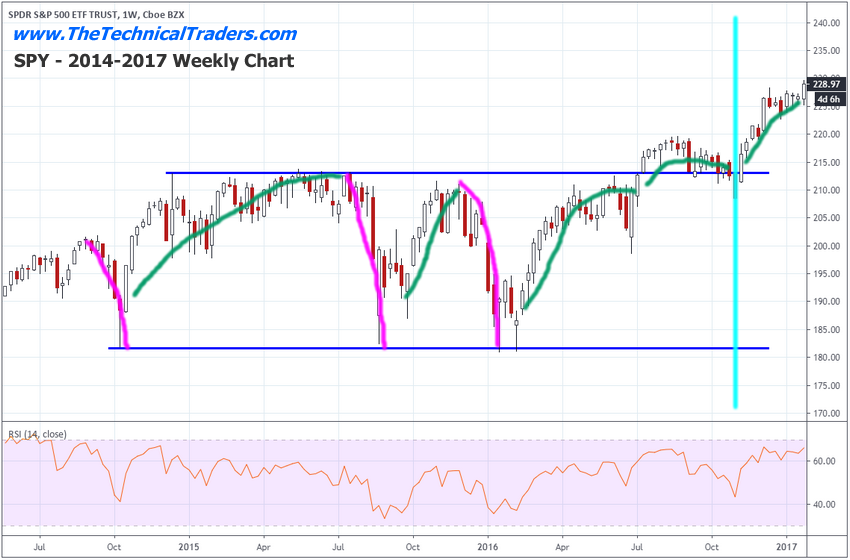
S&P 500 Index 2014-2017 US Presidential Election Cycle
This next chart is the 2014-2017 US Presidential Election cycle and this chart highlights a very different time in US history. There was no massive housing/credit crisis event. There was no massive implosion of the US or global markets taking place throughout this time. There was only a heated battle between two candidates. The chart shows how 2015, nearly 12 months prior to the election date, the market price collapsed twice to complete a double-bottom pattern. This pattern seems to set up prior to election cycles with fairly high consistency.
As we progress to the 12 month period just before the election date (highlighted in CYAN), we can see the 2016 election year resulted in a moderate upside price bias after establishing a bottom very early in 2016. Still, there was a decent amount of volatility throughout the year – particularly in June and the 60 days prior to the actual election date.
Remember, other than political drama, this election cycle didn’t include any massive economic crisis events which could have altered the direction of the markets closer to the election date. The deeper double-bottoms set up the price range headed into the election date and the lack of surprise/crisis events prompted a moderate upside price bias leading into the election event.
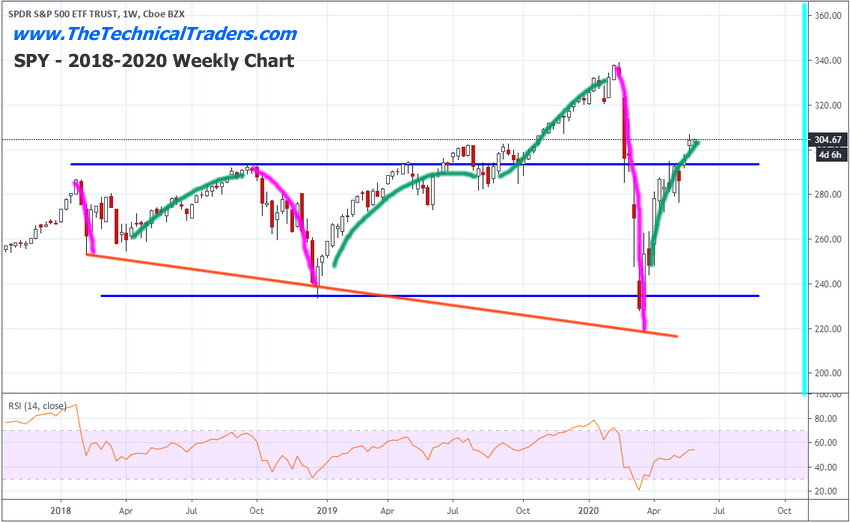
S&P 500 CURRENT 2017-2020 US Presidential Election Cycle
Now, we take a look at the current 2017-2020 setup. This time, because of the prior extended rally in the markets from 2017, we’ve seen a series of deeper price lows setups into an expanding bottom/downward sloping price trend. This is somewhat unusual and suggests volatility is excessive at this time in the markets. We’ve also experienced the COVID-19 virus event occur, which is acting like the 2008 housing/financial crisis event.
At this point, heading into early June 2020 and understanding that these Presidential election cycle events typically result in much greater volatility as we get closer to the election date, our research team believes the June through August period could prompt a broad market downside retracement which coincides with Q2 data/expectations. The month of June prior to the election date (Q2) appears to be a very instrumental period for the markets.
The downward sloping lows on this chart suggest a deeper price rotation may occur as the markets move closer to the election date and continue to process the technical and economic data. The uncertainty related to Presidential election cycles is still at play in the markets. Should some type of crisis event unfold in the midst of the final 5 to 6 months prior to the election date, the risk of a downside price event would become much more excessive.
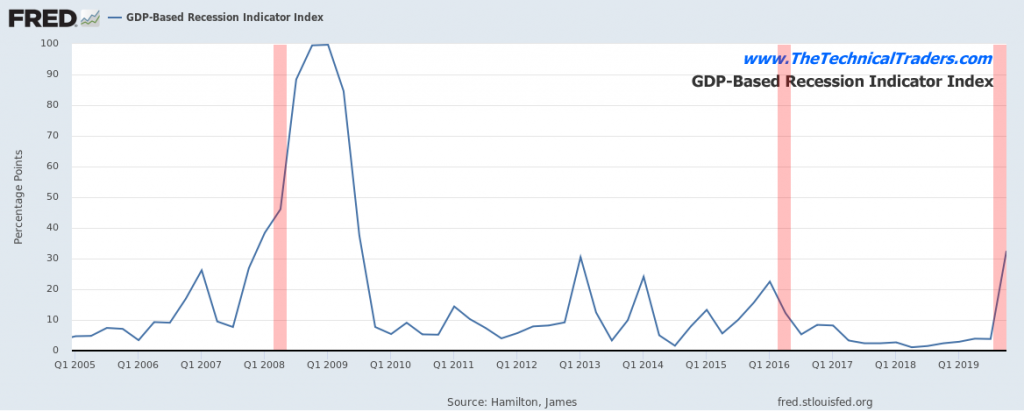
GDP Based Recession Indicator
Currently, the COVID-19 virus event has set up a critical price event headed into the 2020 Presidential election cycle which is somewhat similar to the 2008 election cycle. Pay attention to the GDP Based Recession Indicator chart below. Notice how the 2008 election cycle correlated with a massive increase in the GDP Based Recession Indicator? Now, see how the current GDP Based Recession Indicator has already begun to spike upward? Unlike what happened in 2016 where the GDP Based Recession Indicator stayed below 30, the current level of this indicator suggests a crisis event is beginning to unfold in 2020.
If this crisis event continues, the process where the price will attempt to properly identify risks and valuation levels will likely take place over the next 8 to 12+ months – which is very similar to what happened in 2008 and 2009. Our researchers believe June 2020 could become a critical month for price activity where the future price trends are established.
Currently, we are urging our friends and followers to stay overly cautious of this upward price trend in the US stock markets. Even though we have seen the NQ and other sectors rally to near all-time highs, we believe the markets are still excessively volatile and the indecision leading up to a Presidential election cycle could prompt some really big price moves in the future. We are still trading the long side of the market and advising our clients to take very low-risk trades which have been properly sized. This is a traders market where skilled technical traders can find incredible gains.
June through August will likely become critical in regards to the future price trends and will likely determine if the markets continue to push higher or rotate downward as concerns and potential crisis events continue to unfold. Historically, June through August prior to a Presidential election cycle are very important measures of what happens near and after the election event.
I hope you found this informative, and if you would like to get a pre-market video every day before the opening bell, along with my trade alerts. These simple to follow ETF swing trades have our trading accounts sitting at new high water marks yet again this week, not many traders can say that this year. Visit my Active ETF Trading Newsletter.
If you have any type of retirement account and are looking for signals when to own equities, bonds, or cash, be sure to become a member of my Long-Term Investing Signals which we issued a new signal for subscribers.
Ride my coattails as I navigate these financial markets and build wealth while others lose nearly everything they own during the next financial crisis.
Chris Vermeulen
Technical Traders Ltd.
Disclosure: This article is the opinion of the contributor themselves. The above is a matter of opinion provided for general information purposes only and is not intended as investment advice. This contributor is not receiving compensation for their opinion.