This ETF King Continues To Lose Funds

Year-to-date, the largest exchange-traded fund by assets under management, the SPDR S&P 500 ETF (SPY), has seen an astonishingly large amount of money flow out of the fund.

Remind you; this is also when the S&P 500, and thus SPY itself, is up 7.09% year-to-date. That is important to note because it highlights that the fund does not necessarily see money leave the fund when the market is getting hit.

The SPY has over $372 billion in assets under management, making it the single largest ETF. SPY also holds the crown of being the most liquid, which may not mean much to the average investor, but that is very important to Wall Street professionals and prominent investment managers.

Liquidity is important because it means these investment managers can get in and out of positions with no genuine concern about whether or not there is a buyer or seller on the other side of their trade.

So how much money has SPY seen leave since the start of 2023? $9.43 billion!

Let that sink in and think about the fact that only about 150 Exchange-traded funds in the US have more than $9 billion in assets under management. That is 150 out of the 3,126 ETFs that investors have to pick from.

SPY lost more assets in three and a half months than nearly 3,000 funds have period.

Why is the money flowing out of SPY?

Unlike during other times when we see significant outflows of ETFs, so far in 2023, it has not been because the market is declining. Typically when the market is in a downturn, we see outflows occur as investors pull their money from risk assets and put it into reduced-risk assets. Think about pulling money out of stocks and putting it into bonds. Continue reading "This ETF King Continues To Lose Funds"

U.S. Stock Market Rolls Lower

Stock market price action is usually conducted in a series of up and down price phases – or waves/cycles. Typically, price will move higher or lower in phases- attempting to trend upward or downward over time. This type of price action is normal. Extended upward trends with very little downward price retracements happen sometimes – but not often. They usually happen in “excess phase” rallies or after some type of news event changes expectations for a symbol/sector.

Putting Concerns Into Perspective – Still Bullish

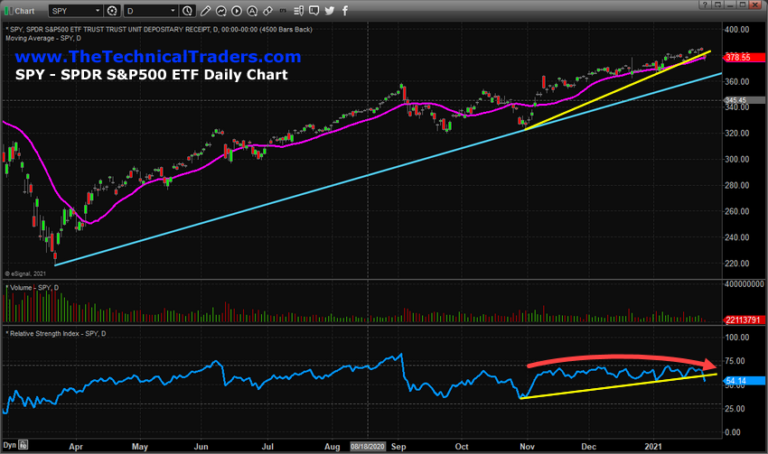
Since early November 2020, the US stock market has continued to rally in a mode that is similar to an excess phase rally – showing very little signs of moderate price rotation. While price volatility has continued to stay higher than normal, you can see from the SPY Daily chart below that it has rallied from $324.40 to $385.95 (over 18%) in just under 90 days. At some point in the future, a moderate price rotation/retracement will happen that may be in excess of 6% to 11% – as has happened in the past.

Stock Market

The purpose of this research post is to alert readers that the markets appear to have started a period of downside price rotation – which is normal. This SPY Daily chart, above, highlights the upward support channel originating from the March 21, 2020, COVID-19 lows (CYAN line) and also the upward support channel originating from the early November 2020 lows (YELLOW line). Continue reading "U.S. Stock Market Rolls Lower"

Election Year Cycles - What To Expect

Every election year over the past five US Presidential election cycles has presented a unique set of price rotation events. Particularly evident in strongly contested US Presidential candidate battles where the voters are consumed with pre-election rhetoric. The 2007-08 election cycle was, in our opinion, very similar to the current market cycle in terms of consumer sentiment and economic function. The 2015-16 election cycle was less similar, yet still important for our researchers.

The economic conditions of the US economy and the global economy were vastly different prior to each US Presidential election cycle and continue to evolve throughout the current 2020 election cycle. Yet, our researchers believe the correlation of price volatility and rotation combined with the distraction for consumers as the election process occupies the hearts and minds of almost everyone across the globe takes a toll on the markets. Prior to almost any US Presidential, price volatility and trends tend to become much more exaggerated and extended.

We’ve published research articles about this technical setup/pattern that occurs in the markets nearly 8 to 15+ months before the US Presidential election cycle before. The basic theory of the setup/pattern is as follows…

  • 12+ months prior to the election date, the parties consolidate around specific candidates where the first battles of the US presidential election cycle conclude.
  • Over the next 12 months, the battle between the selected candidates becomes more heated and aggressive as voters are pushed information and disinformation related to their decisions.
  • The process of the election and the decision-making process for consumers/voters is very stressful and distracts from the normal economic activity for many. This distraction translates into an indecisive market where future expectations (optimism and pessimism) greatly depend on the outcome of the election. Thus, the markets are stuck in a “no man’s land” type of “stasis” waiting for the election event to conclude.

Depending on the events that lead up to the election date, the stock market could be biased towards a bullish trend or a bearish trend which can have a big impact on the pre and post-election outcomes.

S&P 500 Index 2006-09 US Presidential Election Cycle

Let's start by taking a look at the 2006-09 (2008 US election cycle) data/chart. Continue reading "Election Year Cycles - What To Expect"

Is A Blow-Off Top Setting Up

Our research team has become increasingly concerned that the US Fed support for the markets has pushed price levels well above true valuation levels and that a risk of a downside price move is still rather high. Recently, we published a research article highlighting our Adaptive Dynamic Learning (ADL) predictive modeling system results showing the US stock market was 12% to 15% overvalued based on our ADL results. Today, Tuesday, May 26, the markets opened much higher, which extends that true valuation gap.

We understand that everyone expects the markets to go back to where they were before the COVID-19 virus event happened – and that is likely going to happen over time. Our research team believes the disruption of the global economy over the past 70+ days will result in a very difficult Q2: 2020 and some very big downside numbers. Globally, we believe the disruption to the consumer and services sector has been strong enough to really disrupt forward expectations and earnings capabilities. We’ve been warning our friends and followers to be very cautious of this upside price trend as the Fed is driving prices higher while the foundations of the global economy (consumers, services, goods, and retail) continue to crumble away.

Our biggest concern is a sharp downside rotation related to overvalued markets and sudden news or a new economic event that disrupts forward expectations. Q2 data will likely be a big concern for many, yet we believe something else could act as a catalyst for a reversion event. Possibly global political news? Possibly some type of extended collateral damage related to the global economy? Possibly something related to earnings expectations going forward through the rest of 2020 and beyond? We believe Continue reading "Is A Blow-Off Top Setting Up"

Critical Price Level Could Prompt A Big Move

As technical traders and researchers, we’ve been paying very close attention to the GREEN ARC Fibonacci resistance level on the SPY as a key level for the US stock market and any hope of a continued upside price rally. The SPY has traded near this level for the past three weeks and appears to be attempting a bit of an upside breakout right now. Yet, we understand a long holiday weekend is upon us in the US, Memorial Day, and after a big upside GAP on Monday, the US stock market has stalled over the past few days. We've also include charts and analysis for the Russell 2000 and the Transportation index.

Our researchers believe this GREEN ARC is still acting as critical price resistance and believe the SPY may sell off into the end of the week resulting in a failed attempt to breach this key resistance level. If this happens, the failed attempt to break this resistance could prompt a change in price trend and initiate a new downside price trend. If this resistance level is broken by the end of this week, then we have a pretty solid indicator that continued bullish price trending may continue.

Absent of any real news that may drive the market trend this holiday weekend and with most of the US still in shutdown mode, we believe the US stock market has continued to trade within this no man’s land area for many weeks now. From the end of April till now, we’ve seen moderate upside price action in certain sectors, yet other sectors continue to show signs of weakness. Continue reading "Critical Price Level Could Prompt A Big Move"