My Latest "Prediction" For 2023

Back in March I posited the notion that the S&P 500 would need to fall to about 2,900 before all of the froth that the Federal Reserve had injected into the market through its various monetary stimulus programs dating back to the Great Recession had finally burned off.

On Christmas Eve the S&P closed at 3844, which would put it 19% below its all-time high of 4,766 on December 27, 2021, or about a year to the day.

In recent days some market prognosticators have been warning that the market is poised to fall another 20%, which would put the index at about 3,000, or slightly above my guesstimate.

So do I feel vindicated, if that is the right word? No, and I hope I’m wrong anyway.

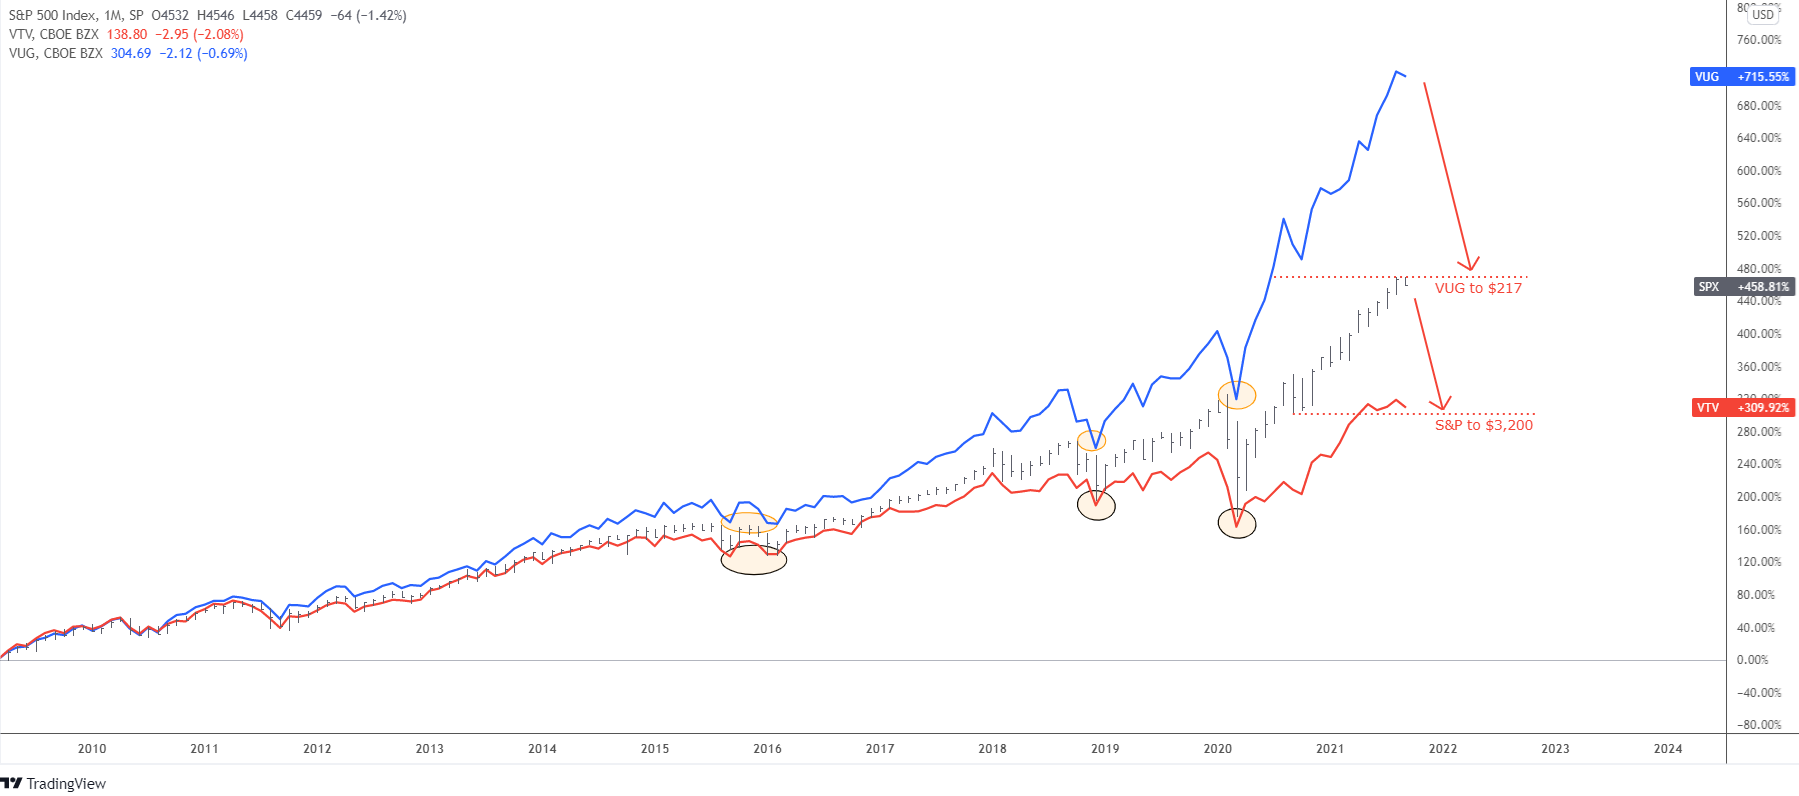
First, my guess was not a prediction, just a quick back-of-the-envelope calculation based on my assumption that the Fed was responsible for about half of the stock market’s 600% gain between the March 2009 bottom of 683 and the time I made my comment.

So, if we cut that 600% gain in half, that would reduce the S&P’s gain to a still respectable 300%, or a little below 3,000.

Not an educated estimate, maybe, but I thought a reasonable guess—a worst case scenario, if you will.

Second, we don’t know if these bears will turn out to be right. I hope they’ll be wrong.

I now believe the Fed won’t have to drive the economy into the tank in order to get inflation down to where it wants it to be, probably in the 2.5% to 3% range.

Remember, about two years, in what was considered to be a major policy shift, the Fed said it was willing to let inflation “overshoot” its long-term target of 2% for a time, as it indeed it did.

Now it looks like inflation is dropping a lot faster than most people thought, and the Fed itself is now forecasting that inflation will fall to 3.1% next year before declining in 2024 to 2.5% and 2.1% in 2025, i.e., putting it at its long-term target. Continue reading "My Latest "Prediction" For 2023"

A Macro View For Stocks, Commodities And Gold

Final rally for stocks, commodities to top, and a final down leg for gold?

This is one man asking one question among several I could be asking, given the volatility of macro indicators on a day-to-day, week-to-week basis. But as FOMC rides off into the sunset it is the scenario that I think is most probable, given the current state of some indicators we follow.

  • The yield curve is on a flattening trend that started signaling the beginning of the end of the inflation trades since the flattener began last April.
  • The Silver/Gold ratio has failed to establish any sort of firm signal to back the inflation trades since silver blew out with the ill-fated #silversqueeze promotion a year ago. That remains the case today.
  • Canada’s TSX-V index has gone bearish nominally and never did break its downtrend in relation to the senior TSX index. This is negative signaling for the more speculative inflation trades.
  • The Baltic Dry index of global shipping prices is in the tank, so to speak, having topped in October and dropped by 75% since.
  • Credit spreads are still intact, but bear watching as nominal junk bonds come under stress.
  • Industrial metals are still rising vs. the gold price, a still-intact macro positive, although Copper/Gold ratio continues to be undecided and a potential warning.
  • Gold had exploded upward vs. US (SPX/SPY) and global (ACWX) stocks. As we noted in an NFTRH update at the time, it would be subject to a potentially severe pullback whether or not the ratio has bottomed. The pullback started on Wednesday (FOMC day, and who is surprised?), and when gold bottoms vs. stocks the macro will be indicated to go quite bearish. For now, we’re neutral on the short-term.

With that macro backdrop in mind, let’s update three areas, US Stocks, Commodities, and Gold. Continue reading "A Macro View For Stocks, Commodities And Gold"

S&P 500 To Lose 30%?

It is not clickbait for hype. I will take you through my observations in this post to show you why it could play out.

Every market has its stages develop over time: Boom and Bust, Growth and Correction, Collapse and Consolidation. The corrective phase could be around for the stock market.

The main question, as always, is how deep it could drop when a retracement unfolds. This is not an easy one. To see the market from different angles, I built the comparison chart as I put the S&P 500 index itself (black bars), then I added Vanguard Value Index Fund ETF (VTV) (red line) and Vanguard Growth Index Fund ETF (VUG) (blue line).

S&P 500

This monthly chart starts from the major bottom in 2009. SINCE THEN, the S&P 500 index has gained more than 450% since then, the value stocks have scored more than 300%, while the growth stocks have made a jaw-dropping 715%. Continue reading "S&P 500 To Lose 30%?"

Market-Cap-Weighted Investing Has Been Good, But Will It Last?

The major US, and well world indexes, for that matter, are all market capitalization-weighted indexes. This means the index will own a particular amount of one company or another based on that company’s market cap. On the surface, this sounds fine. And decades ago, when the indexes were really starting, this method worked just fine. It was a fast, easy, and simple way for investors and money managers to put together the index.

But fast forward to today and beyond, and market cap indexes may not be the best solution due to the simple issue of the index being too heavily weighted. In a past article, I highlighted how the top 5 companies in the S&P 500 represented 23% of the index. That means 5 companies represent almost a quarter of what an index that supposedly tracks 500 companies is doing.

However, over the past few years, especially the past year, these top five companies, Apple (AAPL), Microsoft (MSFT), Amazon.com (AMZN), Facebook (FB), and Alphabet (GOOG), have performed incredibly well. So, investors who have ridden these market-cap-weighted indexes higher for a few years are very happy and have done very well.

However, there is always a downside risk, and with these market-cap-weighted indexes being so heavily weighted to the top 5 or 10 stocks, the risk is much higher than most investors fully understand. Continue reading "Market-Cap-Weighted Investing Has Been Good, But Will It Last?"

Irrational Exuberance?

The broader indices have been in a raging bull market since the COVID-19 induced lows in March of 2020. The rally has been largely uninterrupted, with minor blimps in September and October before reaching all-time highs by early December. The initial rally was narrowly focused on technology and the stay-at-home economy stocks. With the improving vaccine prospects, November saw a sea change with broad market participation with value stocks breaking out with huge moves to the upside. To boot, massive stimulus coming out of Washington is being priced into the markets. All three major indices (S&P 500, Nasdaq, and Dow Jones) are at all-time highs. Are stocks overextended underpinned by irrational exuberance considering the damaging economic consequences that COVID-19 inflicted on the worldwide economy? Are markets getting ahead of themselves as investors bet on a return to normal for the global economy? Stretched valuations, options put/call ratios, broad participation, and P/E ratios may be potential warning signs of near-term pressures.

irrational exuberance

Fundamentals – Lofty P/E Ratios

Price-to-Earnings ratios are largely discordant with the economic backdrop and at historically lofty levels. Outside of the tech bubble in 1999/2000, the current P/E ratio of the S&P 500 composite is the highest on record, exceeding that of the Roaring Twenties (Figure 1). Continue reading "Irrational Exuberance?"