
2022 Bear Market
Although there’s not an official bear market definition, those on Wall Street define a bear market as a 20% drop in the broader index. As of late May, the Nasdaq, Russell 2000, and S&P 500 have all breached that 20% sell-off threshold. This bear market is largely due to a confluence of the China Covid lockdowns, the Russia/Ukraine war, persistent inflation, and rising rates. All these bear market inputs are eroding companies’ margins and negatively impacting profitability and growth.
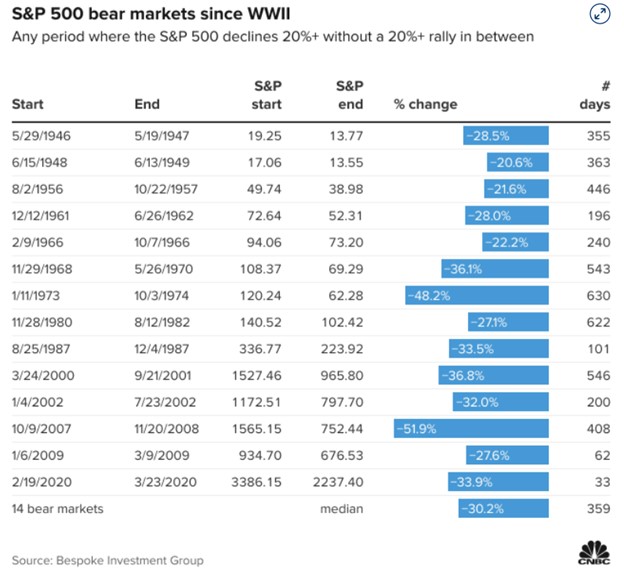
Looking at historical bear market comparators, there’s been 14 since World War II. The S&P 500 has pulled back a median of 30% and the selling has lasted a median of 359 days, per Bespoke Investment Group. It’s important to put the median in a statistical context, median translates into half the time the index has fallen more than 30% while half the time the index has remained above the 30% sell-off level. The 2022 bear market is only 136 days in as of March 20th, 2022. Although the median values suggest these markets may have a way to go, the resolution of one or a combination of the macroeconomic issues may be the needed catalyst for the bears to capitulate.
Markets On Edge
It's been challenging to endure the last five months of indiscriminate and relentless selling across all asset classes. The wealth destruction has been vast and safe haven stocks have been few and far between at this stage of the bear market. The bear has finally mauled Walmart (WMT), Apple (AAPL), and the flight to safety commodity, Gold (GLD) in its path of destruction.
Although market conditions seem hopeless at the moment, the weakness will abate, and financial markets will improve. The markets are contending with major macroeconomic headwinds that are wreaking havoc on companies’ profit margins.
The broader markets are experiencing levels of weakness not seen since the Covid-induced sell-off, the Financial Crisis, and the dot-com bust.
It’s these extreme market conditions where portfolio agility and patience are required via dollar cost averaging in high-quality, profitable companies. Although the bottom cannot be timed perfectly, purchasing high-quality companies at heavily discounted valuations is possible in the current climate.
Overall Markets
The Federal Reserve raised interest rates by 50 basis points which was not only needed but a modest step to combat decades’ high inflation. Companies are already feeling the inflation pinch when using earnings from Walmart (WMT) and Target (TGT) as proxies. Profit margins are being squeezed and costs are soaring across all sectors of the economy.
The Nasdaq has fared far worse than the S&P 500, selling off 30% from its record high, reminiscent of the 2001 dot-com bubble bursting. The Nasdaq fell for seven consecutive weeks, the longest losing streak in over 20 years.
It is noteworthy to highlight that the S&P 500 has only experienced double-digit annual losses in just 13 of the last 94 years through 2021. Thus, absent any systemic risk (i.e., Financial Crisis), this bear market may run its course soon enough. Taking into account all 14 bear markets, the average sell-off reached -34.1%, and excluding the Financial Crisis of 2007, the average sell-off was reached -32.8%.
Conclusion
When analyzing the 14 historical bear markets since World War II, the S&P 500 has pulled back a median of 30%, and the selling has lasted a median of 359 days. Thus, half the time the index has fallen more than 30% while half the time the index has remained above the 30% sell-off level. Whereas the average sell-off of all 14 bear markets reached -34.1% and excluding the Financial Crisis of 2007, the average sell-off was reached -32.8%. The 2022 bear market is only 136 days in as of March 20th, 2022, suggesting that the length and severity of the current bear market may need to play out longer.
However, as history also indicates, establishing long-term positions during corrections can lead to outsized gains over the intermediate and long term. Thus, as the selling pressure abates and the macroeconomic backdrop resolves, building equity stakes in high-quality companies bodes well for investors. The current market backdrop is the exact scenario where investors should be deploying cash on-hand to snap up heavily discounted merchandise.
Noah Kiedrowski
INO.com Contributor
Disclosure: Stock Options Dad LLC is a Registered Investment Adviser (RIA) firm specializing in options-based services and education. There are no business relationships with any companies mentioned in this article. This article reflects the opinions of the RIA. Any recommendation contained in this article is subject to change at any time. No recommendation is intended to constitute an entire portfolio. The author encourages all investors to conduct their own research and due diligence prior to investing or taking any actions in options trading. Please feel free to comment and provide feedback; the author values all responses. The author is the founder and Managing Member of Stock Options Dad LLC – A Registered Investment Adviser (RIA) firm www.stockoptionsdad.com defining risk, leveraging a minimal amount of capital and maximizing return on investment. For more engaging, short-duration options-based content, visit Stock Options Dad LLC’s YouTube channel. Please direct all inquires to in**@st*************.com. The author holds shares of AAPL, ACN, ADBE, AMD, AMZN, ARKK, AXP, BA, BBY, C, CMG, COST, CRM, DIA, DIS, EW, FB, FDX, FXI, GOOGL, GS, HD, HON, IBB, INTC, IWM, JPM, LULU, MA, MS, MSFT, NKE, NVDA, PYPL, QCOM, QQQ, SBUX, SPY, SQ, TMO, UNH and V.
bear market started out of 30 sensex consitute 24 are in bear trap. only RELIANCE IS in upside .when reliance become stable or move down side, market will tremble like anything