Worst First-Half Since 1970 - Time To Capitalize?

This has been the stock market’s worst first-half in over 50 years with inflation serving as the main culprit and a slew of ancillary pressures from China’s Covid lockdowns and the Ukraine/Russia conflict.

Through the first six months, no sector has been immune from the breath and reach of this bear market. The S&P 500, Nasdaq and Russell 2000 are well in bear market territory at June’s end.

Risk appetite across the spectrum has been eroded. The crypto market has collapsed, traditional IPOs and SPACs have dried up and several commodities have collapsed as of late.

Despite this massive wealth destruction, strategists from major Wall Street firms are forecasting that stocks will recapture most of their losses in the back half of the year.

The S&P 500 is expected to finish the year more than 20% higher from the end of June’s levels per the average year-end target derived from the top 15 Wall Street strategists. This forecast translates into the market recapturing most of the year’s losses, albeit finishing the year with a negative return of ~3%.

Deploying Capital

During bear markets or an extended period of a market-wide bear backdrop, investors have the unique opportunity to purchase heavily discounted stocks at a fraction of the price when compared to their peaks.

As history indicates, establishing long-term positions during corrections can lead to outsized gains over the intermediate and long term. As the selling pressure abates and the macroeconomic backdrop resolves, building equity stakes in high-quality companies bodes well for long term investors.

As the macro issues resolve over time, the markets will regain their footing and appreciate higher. The current market backdrop is the exact scenario where investors should be deploying cash on-hand to snap up heavily discounted merchandise in a diversified and dollar cost averaging manner.

Behind the Inflation Curve

The Federal Reserve has fallen far behind the inflation curve, putting through reactive interest rate hikes of 1.5 percentage points, with more to come throughout 2022.

Many politicians and executives have been sounding the inflation alarm since Q4 of 2021 to no avail while the Fed continued to buy bonds and pump liquidity into the system.

The latest inflation numbers by the Labor Department came in at 8.6%, the highest since December 1981. The reactionary Fed and runaway inflation have caused havoc on Wall Street while the Fed attempts to slam the breaks on the economy.

Second Half Bounce?

Although the first half of this year ranks among the worst in history, the selling may ease in the second half if history is any guide.

When the S&P 500 plunged 21% in the first half of 1970, it promptly reversed those losses to gain 26.5% in the second half and post a slight gain for the year. 1932, 1940, 1962 and 1970 saw first half decimation on par with 2022 however every one of those years saw a second half rebound.

Only one year saw the market recover the losses it incurred during the first half, in 1970 (Figure 1).
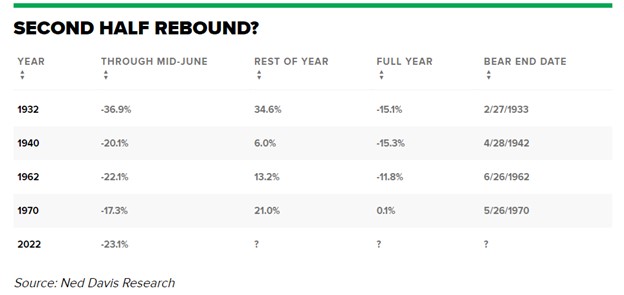
Figure 1

Figure 1 – Historical perspective of worst first half market performances and the respective full year outcomes when factoring in the second half of the year

Recession Possibility and Type

With the possibility of recession, there’s different underpinnings of a bear market that are broken out into cyclical-driven, structural-driven and “event-driven” stock declines of 20% or more.

Goldman Sachs (GS) holds the position that investors are experiencing a cyclical bear market which is marked by high inflation and rising interest rates. This combination results in price-to-earnings multiple contraction and thus a reduction in valuations.

The current climate is buffered against a structural bear market that is buoyed by strong corporate and household balance sheets. The positive side is that the average cyclical bear market lasts two years, far shorter than the average three in half years for a structural bear market. The average price decline during a cyclical bear market is only about 31% versus 57% during a structural one per Goldman.

Cash On-Hand

Deploying cash into an environment where the selling is relentless and indiscriminate can be a daunting task. However, for any portfolio structure, having cash on-hand is essential and in these environments is where this cash should be deployed in equities.

This cash position provides investors with flexibility and agility when faced with market corrections. Cash enables investors to be opportunistic and capitalize on stocks that have sold off and have become de-risked.

Initiating new positions and dollar cost averaging during these extended periods of weakness are great long-term drivers of portfolio appreciation. Absent of any systemic risk, there’s a lot of fantastic entry points for many high-quality large cap companies. Investors should not remiss and capitalize on this buying opportunity because it may not last too long.

Anchoring and Dollar Cost Averaging

Purchasing stocks at the exact bottom is nearly impossible however purchasing stocks at attractive valuations in a disciplined manner over time is possible.

Dollar cost averaging is a great strategy to use when anchoring down into a position with an initial sum of capital and following through with additional incremental purchases as the stock declines further. The net benefit is reducing the average purchase price per share in a sequential fashion (i.e., reducing cost basis). An example of building out a high-quality portfolio with subsequent dollar cost averaging throughput this market weakness can be seen in Figure 2.
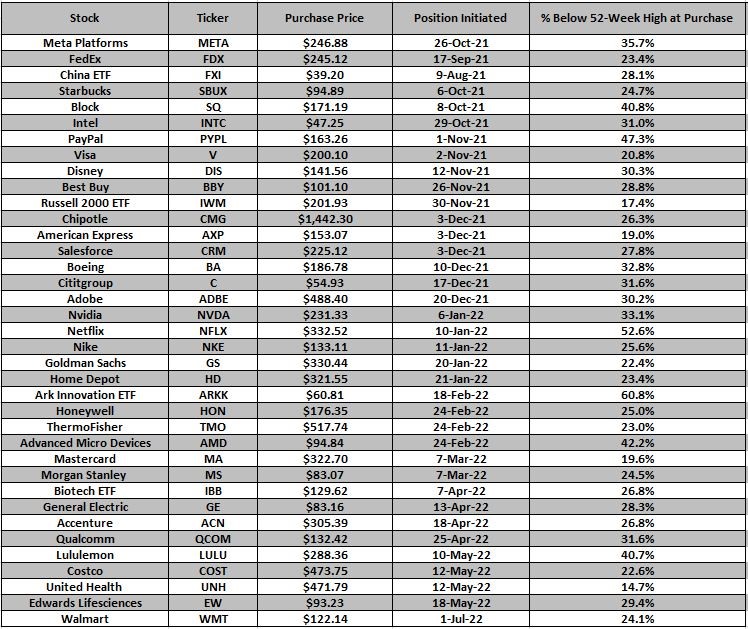
Figure 2

Figure 2 – Initiating positions in high quality companies with subsequent dollar cost averaging to build out a well-diversified portfolio. These long equity trades along with options-based trades can be found via the Trade Notification service.

Conclusion

This has been the stock market’s worst first-half in over 50 years where no sector has been immune from the breath and reach of this bear market. The S&P 500, Nasdaq and Russell 2000 are well in bear market territory at June’s end.

Despite this massive wealth destruction, strategists from major Wall Street firms are forecasting that stocks will recapture most of their losses in the back half of the year. The S&P 500 is expected to finish the year more than 20% higher from the end of June’s levels per top Wall Street strategists.

Purchasing stocks at the exact bottom is nearly impossible however purchasing stocks at attractive valuations in a disciplined manner over time is possible. During bear markets, investors have the unique opportunity to purchase heavily discounted stocks at a fraction of the price when compared to their peaks.

As history indicates, establishing long-term positions during corrections can lead to outsized gains over the intermediate and long term. As the selling pressure abates and the macroeconomic backdrop resolves, building equity stakes in high-quality companies bodes well for investors. The current market backdrop is the exact scenario where investors should be deploying cash on-hand to snap up heavily discounted merchandise.

Noah Kiedrowski
INO.com Contributor

Disclosure: Stock Options Dad LLC is a Registered Investment Adviser (RIA) firm specializing in options-based services and education. There are no business relationships with any companies mentioned in this article. This article reflects the opinions of the RIA. Any recommendation contained in this article is subject to change at any time. No recommendation is intended to constitute an entire portfolio. The author encourages all investors to conduct their own research and due diligence prior to investing or taking any actions in options trading. Please feel free to comment and provide feedback; the author values all responses. The author is the founder and Managing Member of Stock Options Dad LLC – A Registered Investment Adviser (RIA) firm www.stockoptionsdad.com defining risk, leveraging a minimal amount of capital and maximizing return on investment. For more engaging, short-duration options-based content, visit Stock Options Dad LLC’s YouTube channel. Please direct all inquires to [email protected]. The author holds shares of AAPL, ACN, ADBE, AMD, AMZN, ARKK, AXP, BA, BBY, C, CMG, COST, CRM, DIA, DIS, EW, FB, FDX, FXI, GOOGL, GS, HD, HON, IBB, INTC, IWM, JPM, LULU, MA, MS, MSFT, NKE, NVDA, PYPL, QCOM, QQQ, SBUX, SPY, SQ, TMO, UNH and V.

Rising Rates: Financials Will Greatly Benefit

The Federal Reserve raised interest rates by 75-basis points at its most recent meeting and forecasted that a similar rate hike could on the table in July. These efforts are necessary to stamp out the persistently high inflation throughout the economy.

The most recent 75-basis point rate hike was the largest since the 1994 rate tightening cycle.

The financial cohort will benefit via a confluence of a rising interest rates, financially strong balance sheets and the easy passage of annual stress tests to support expanded buybacks and increased dividends.

Bank of America (BAC), JPMorgan Chase (JPM), Morgan Stanley (MS), Citigroup (C) and Goldman Sachs (GS) look appealing at these levels, off substantially from their 52-week highs.

Net Interest Income

Net interest income is an important financial measure that is essentially the difference between interest paid and interest received thus the revenue generated by its loans and interest paid out on its deposit base.

Bank stocks perform well in a rising interest rate environment as the interest income earned from loans rises faster than what they pay for funding. The higher interest rates go, the greater the net interest income banks earn.

Immaterial Geopolitical Exposure

The big banking cohort has minimal to no direct exposure to Russia/Ukraine thus not tied directly to the geopolitical conflict. This is especially important as the geopolitical tensions rage on and possibly snap up these stocks as a function of overall market sentiment.

Overall, the big banks generate an inconsequential amount of revenue from Russia. For example, BAC, JPM and MS do not have direct exposure to Russia in their regulatory filings.

However, GS is estimated to have $940 million total exposure to Russia and Ukraine, or less than 0.1% of its total assets, per Bank of America. Citigroup (C) had $9.8 billion exposure to Russia, including $5.4 billion in Russia-specific exposure, equating to only 0.3% of the bank’s total assets.

As such, there is not a single company within the collective big bank cohort has any more than 0.3% of its total assets exposed to the Russian/Ukraine conflict.

2022 Financial Stress Tests

The financial cohort easily cleared the Federal Reserve's annual stress test, removing any concern that there’s systemic financial risk in the economy, circa 2008.

The results of the Fed's annual stress test exercise showed the banks have enough capital to weather a severe economic downturn and paves the way for them to expand share buybacks and increase dividend payouts.

The 34 lenders with more than $100 billion in assets that the Fed oversees would suffer a combined $612 billion in losses under a hypothetical severe downturn, the central bank said. But that would still leave them with roughly twice the amount of capital required under its rules.

The Fed assesses how banks' balance sheets would fare against a hypothetical severe economic downturn. The results dictate how much capital banks need to be healthy and how much they can return to shareholders via share buybacks and dividends. This stress test gives investors comfort that the big banks are well-prepared for a potential U.S. recession.

The 2022 stress tests are especially important as the world faces a geopolitical crisis that may reverberate through the global economy. All this considered, it’s refreshing to know that these stress tests were easily passed and indicate that the biggest U.S. banks could easily withstand a severe recession.

Conclusion

The geopolitical backdrop, rising inflation, China Covid lockdowns and rising interest rates will continue to weigh on investor sentiment.

The financial cohort is much more resilient and capitalized and have demonstrated their ability to evolve in the face of the pandemic and will weather these economic challenges as well. The 2022 stress tests were easily passed and indicate that the biggest U.S. banks could easily withstand a severe recession or geopolitical crisis.

This cohort presents compelling value, especially with substantially reduced valuations in a rising interest rate environment into 2023, which may serve as a long-term tailwind for banks to appreciate higher.

Just recently, MS and BAC boosted dividend by 11% and 5%, respectively. MS also authorized a new $20 billion share repurchase program. The positive results of these annual stress tests will likely allow expanded capital returns over the years to come in a fiscally responsible and accountable manner.

Noah Kiedrowski
INO.com Contributor

Disclosure: Stock Options Dad LLC is a Registered Investment Adviser (RIA) firm specializing in options-based services and education. There are no business relationships with any companies mentioned in this article. This article reflects the opinions of the RIA. Any recommendation contained in this article is subject to change at any time. No recommendation is intended to constitute an entire portfolio. The author encourages all investors to conduct their own research and due diligence prior to investing or taking any actions in options trading. Please feel free to comment and provide feedback; the author values all responses. The author is the founder and Managing Member of Stock Options Dad LLC – A Registered Investment Adviser (RIA) firm www.stockoptionsdad.com defining risk, leveraging a minimal amount of capital and maximizing return on investment. For more engaging, short-duration options-based content, visit Stock Options Dad LLC’s YouTube channel. Please direct all inquires to [email protected]. The author holds shares of AAPL, ADBE, AMD, AMZN, ARKK, AXP, BA, BBY, C, CMG, COST, CRM, DIA, DIS, EW, FB, FDX, FXI, GOOGL, GS, HD, HON, INTC, IWM, JPM, MRK, MS, MSFT, NKE, NVDA, PYPL, QQQ, SPY, SQ, TMO, UNH, USO, V and WMT.

Window of Opportunity - Valuations Below Pre-Pandemic Highs

Window of Opportunity

Six months of relentless and indiscriminate selling has roiled the markets. This selling has reduced the frothy pandemic induced run-up in stocks back to pre-pandemic levels. In many cases stocks are trading well below the pre-pandemic highs.

Stocks are now presenting a window of opportunity for long-term investors at this juncture. With the collective P/E ratios reverting to its historical mean, oversold conditions at extremes and the inflation picture at a potential inflection point may combine to be a back half of the year reprieve.

This window of opportunity may not last too much longer based on historical bear market metrics so pounce and pounce harder if the markets slide further.

Mid-June Flushing?

Many commentators in the investing circles stated that a final washout in the market was likely needed prior to moving higher in any meaningful way.

Mid-June saw its worst weekly performance since March of 2020, dropping 5.8% for the S&P 500 while taking its overall decline to ~24%. After this brutal week, there hasn’t been any stock or sector that has been immune to the breadth of participation in this sell-off. As such, the market has now registered abnormal extremes in selling and oversold conditions.

Is this the washout that was needed to arrest the selling pressures in this market, and will this be an inflection point? A battery of indicators suggest that the markets are close to making a meaningful move higher very soon.

Inflection Point?

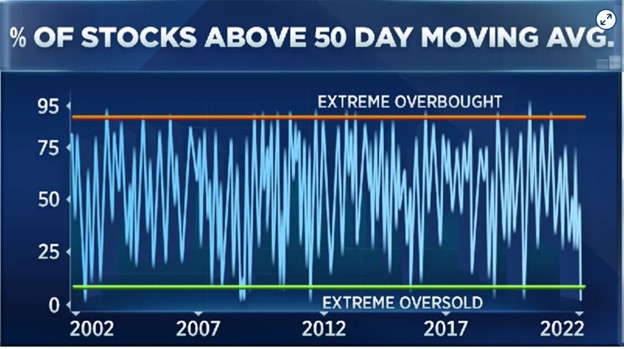
The percentage of S&P 500 stocks trading above their 50-day average hit a level that can’t go any lower as seen over the past 20 years. This level indicates extremely oversold conditions (Figure 1).  

% Stocks Above 50-Day Moving Average

Figure 1 – Assessing overbought and oversold conditions via the percent of stocks relative to its 50 day moving average (adopted from CNBC).

It’s noteworthy to highlight that fewer than 25% of stocks are still within 20% of their 52-week high. The only times this was worse was the Covid crash and the 2007-2009 financial crisis. Over 42% of S&P 500 stocks hit a new 52-week low, only the tenth time since 1985 this total exceeded 40%.

The average Nasdaq stock has undergone a 50% drop from its high. The S&P 500 now trades at a level first reached more than 16 months ago in early 2021. This move negates the post-Covid advance in equity markets. The correction waves in February 2016 and December 2018 both bottomed at levels first reached nearly two years prior. Thus, these markets are reaching the point where the past two years of appreciation has been erased.

Stocks Are Looking Cheap

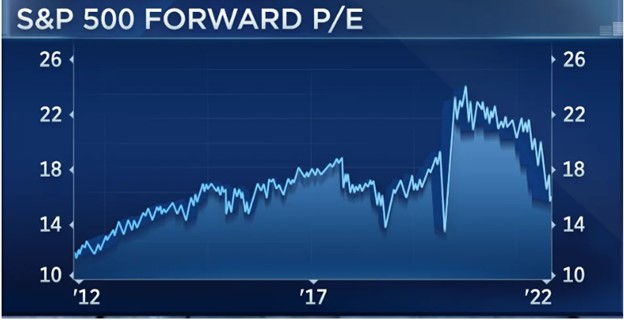
The current collective P/E a ~16, well off the pre-Covid high and not far above where it has bottomed in prior severe sell-offs in 2016, 2018 and 2020 closer to a P/E of ~14. The equal-weight S&P 500 finished mid-June at 13.1-times earnings. It’s noteworthy to point out that the markets bottomed in December 2018 at 12.9 and in March 2020 at 11 (Figure 2).  

SP500 Forward P/E

Figure 2 – Assessing P/E ratios over the past 10 years (adopted from CNBC).

Conclusion

The relentless and indiscriminate selling has reduced the frothy pandemic induced run-up in stocks back to pre-pandemic levels. Stocks are now presenting a window of opportunity for long-term investors at this juncture.

With the collective P/E ratios reverting to its historical mean, oversold conditions at extremes and the inflation picture at a potential inflection point may combine to be a back half of the year reprieve.

The percentage of S&P 500 stocks trading above their 50-day average hit a level that can’t go any lower as measured relative to the past 20 years. This level indicates extremely oversold conditions.

Fewer than 25% of stocks are still within 20% of their 52-week high. The only times this was worse was the Covid crash and the 2007-2009 financial crisis. Over 42% of S&P 500 stocks hit a new 52-week low, only the tenth time since 1985 this total exceeded 40%. The average Nasdaq stock has undergone a 50% drop from its high.

Bank of America’s Bull & Bear Indicator, which captures fund flows and other market-based risk-appetite measures, is well in the fearful depths that typically imply a buying opportunity. During prolonged stressed periods (i.e., 2000-’02 and 2008-’09) bear markets had this gauge persistently stuck at these low levels while prices continued to trend lower.

This window of opportunity may not last too much longer based on historical bear market metrics so pounce and pounce harder if the markets slide further.

Noah Kiedrowski
INO.com Contributor

Disclosure: Stock Options Dad LLC is a Registered Investment Adviser (RIA) firm specializing in options-based services and education. There are no business relationships with any companies mentioned in this article. This article reflects the opinions of the RIA. Any recommendation contained in this article is subject to change at any time. No recommendation is intended to constitute an entire portfolio. The author encourages all investors to conduct their own research and due diligence prior to investing or taking any actions in options trading. Please feel free to comment and provide feedback; the author values all responses. The author is the founder and Managing Member of Stock Options Dad LLC – A Registered Investment Adviser (RIA) firm www.stockoptionsdad.com defining risk, leveraging a minimal amount of capital and maximizing return on investment. For more engaging, short-duration options-based content, visit Stock Options Dad LLC’s YouTube channel. Please direct all inquires to [email protected]. The author holds shares of AAPL, ACN, ADBE, AMD, AMZN, ARKK, AXP, BA, BBY, C, CMG, CRM, DIA, DIS, FB, FDX, FXI, GOOGL, GS, HD, HON, IBB, INTC, IWM, JPM, MA, MS, MSFT, NKE, NVDA, PYPL, QCOM, QQQ, SBUX, SPY, SQ, TMO, and V.

Taming Inflation - Tough Action Needed

Curbing Inflation - The Priority

Rolling back inflation is an absolute necessity before these markets can start to turn back this tide of relentless selling. The process of curbing inflation will not be quick, nor will it be an easy feat. A delicate balance must be exercised to curb inflation via rising rates while not destroying the economy.

To curtail these 40-year highs in inflation, the economy will need to slow, demand will need to cool and the supply chain will need time to catch up to come back into balance.

The Federal Reserve will raise short-term interest rates from historic lows near zero as the economy recovered from the pandemic. The Federal Reserve will be looking for lower CPI numbers, softer labor market conditions and resolution of supply chain constraints prior to taking a dovish stance on future rate hikes. The latter will be the confluence of catalysts the market needs to propel higher.

Overall Markets

The overall markets have been under heavy and relentless selling. The average Nasdaq stock has undergone a 50% drop from its high.

The S&P 500 now trades at a level first reached more than 16 months ago in early February 2021. This move negates the post-Covid advance in equities.

The multi-wave corrections that culminated in February 2016 and December 2018 both bottomed at levels first reached nearly two years prior. Thus, these markets are reaching the point where the past two years of appreciation has been erased.

Bank of America’s Bull & Bear Indicator, which captures fund flows and other market-based risk-appetite measures, is well in the fearful depths that typically imply a buying opportunity. During prolonged stressed periods (i.e., 2000-’02 and 2008-’09) bear markets had this gauge persistently stuck at these low levels while prices continued to trend lower.

University of Michigan consumer sentiment poll came in at a level lower than during the global financial crisis and if not revised higher will rank as the bleakest monthly reading since 1978. Extreme negative readings in the University of Michigan poll have served as great inflection points for how stocks perform over the subsequent 12-month period.

Per JPMorgan the S&P 500 has averaged a 25% gain in the year following the eight Michigan sentiment troughs going back 50 years, with the worst return at 14%.

It’s noteworthy to point out that hindsight is 20/20 thus troughs are only known in a look-back analysis after sentiment starts to recover from a low. The markets may be close but may not be at this point yet.

Key Macroeconomic Factors

The Consumer Price Index (CPI) has become the most influential and critical variable in today’s market. The CPI readings directly impact monetary policy put forth by Federal Reserve via interest rate hikes, bond buying and liquidity measures.

Inflation continues to be persistent throughout the economy and the Federal Reserve must balance curtailing inflation without destroying the economy. The impact of inflation is now flowing through to companies and consumers alike. Inflation has reared its ugly head and is now negatively impacting companies’ gross margins and dampening consumer demand due to soaring prices, specifically gasoline.

The confluence of rising interest rates, inflation, China Covid lockdowns and the war in Ukraine has resulted in first half of 2022 overwhelmingly negative. As such, the market appears to be factoring in a worst-case scenario that may result in a Federal Reserve induced recession as a function of over-tightening on monetary policy and/or its inability to combat inflation responsibly to engineer an economic “soft landing”.

However, if any of these macroeconomic factors abate (i.e., CPI, China re-opening, Russian/Ukraine conflict and interest rate hikes) this could serve as a launching pad for the markets to stabilize and appreciate higher.

Inflation - 40 Year Highs

Inflation pushed higher in May as prices rose 8.6% from a year ago for the fastest increase in nearly 40 years. Excluding volatile food and energy prices, core CPI was up 6%. Both CPI and core CPI exceeded estimates and came in hotter than expected. Surging costs for shelter, gasoline and food prices all contributed to the increase.

The latest CPI numbers casted doubt that inflation may have peaked and adds to fears that the U.S. economy is nearing a recession.

The CPI report comes at a time when the Federal Reserve is in the early stages of a rate-hiking campaign to slow growth and bring down prices. May’s report likely locks-in multiple 50 basis point interest rate increases ahead. With 75 basis points of rate rises already put in place, markets widely expect the Fed to continue tightening through 2022 and likely into 2023.

Conclusion

Curbing inflation is an absolute necessity for the markets to stabilize and start to reverse the tide of relentless selling. A delicate balance must be exercised to curtail these 40-year highs in inflation.

As a consequence, the economy will need to slow, demand will need to cool and the supply chain will need time to catch up to come back into balance.

The Federal Reserve will be looking for lower CPI numbers, softer labor market conditions and resolution of supply chain constraints prior to taking a dovish stance on future rate hikes. The latter will be the confluence of catalysts the market needs to propel higher.

The Consumer Price Index (CPI) has become the most influential and critical variable in today’s market. The impact of inflation is now flowing through to companies and consumers alike with Target and Walmart issuing profit warnings.

The market appears to be factoring in a worst-case scenario that may result in a Federal Reserve induced recession as a function of over-tightening on monetary policy and/or its inability to combat inflation responsibly to engineer an economic “soft landing”. It will likely take successive downward CPI readings before rates will stabilize and the markets can appreciate higher.

However, if any of the other macroeconomic factors abate (i.e., China re-opening and Russian/Ukraine conflict) this could serve to accelerate the stabilization of the markets and remove the functional constraints for the markets to appreciate higher.

Noah Kiedrowski
INO.com Contributor

Disclosure: Stock Options Dad LLC is a Registered Investment Adviser (RIA) firm specializing in options-based services and education. There are no business relationships with any companies mentioned in this article. This article reflects the opinions of the RIA. Any recommendation contained in this article is subject to change at any time. No recommendation is intended to constitute an entire portfolio. The author encourages all investors to conduct their own research and due diligence prior to investing or taking any actions in options trading. Please feel free to comment and provide feedback; the author values all responses. The author is the founder and Managing Member of Stock Options Dad LLC – A Registered Investment Adviser (RIA) firm www.stockoptionsdad.com defining risk, leveraging a minimal amount of capital and maximizing return on investment. For more engaging, short-duration options-based content, visit Stock Options Dad LLC’s YouTube channel. Please direct all inquires to [email protected]. The author holds shares of AAPL, ACN, ADBE, AMD, AMZN, ARKK, AXP, BA, BBY, C, CMG, CRM, DIA, DIS, FB, FDX, FXI, GOOGL, GS, HD, HON, IBB, INTC, IWM, JPM, MA, MS, MSFT, NKE, NVDA, PYPL, QCOM, QQQ, SBUX, SPY, SQ, TMO, and V.

CPI Readings – The Market’s Blight

The Consumer Price Index (CPI) has become the most influential and critical variable in today's market. The CPI readings directly impact monetary policy put forth by Federal Reserve via interest rate hikes, bond buying, and liquidity measures.

Inflation continues to be persistent throughout the economy and the Federal Reserve must balance curtailing inflation without destroying the economy. The impact of inflation is now flowing through to companies and consumers alike. Inflation has reared its ugly head and is now negatively impacting companies' gross margins and dampening consumer demand due to soaring prices, specifically gasoline.

The confluence of rising interest rates, inflation, China Covid lockdowns and the war in Ukraine has resulted in months of selling. The relentless, indiscriminate selling has pushed the Dow Jones and S&P 500 deep into correction territory while pushing the Nasdaq deep into a bear market.

As such, the market appears to be factoring in a worst-case scenario that may result in a Federal Reserve induced recession as a function of over-tightening on monetary policy and/or its inability to combat inflation responsibly to engineer an economic "soft landing". The overall market is in a precarious position, and it'll likely take successive downward CPI readings before rates will stabilize and the markets can appreciate higher.

Inflation – 40-Year Highs

Inflation pushed higher in May as prices rose 8.6% from a year ago for the fastest increase in nearly 40 years. Excluding volatile food and energy prices, core CPI was up 6%.

Both CPI and core CPI exceeded estimates and came in hotter than expected. Surging costs for shelter, gasoline and food prices all contributed to the increase. The latest CPI numbers cast doubt that inflation may have peaked, adding to fears that the U.S. economy is nearing a recession.

The CPI report comes at a time when the Federal Reserve is in the early stages of a rate-hiking campaign to slow growth and bring down prices. May's report likely locks in multiple 50 basis point interest rate increases ahead. With 75 basis points of rate rises already put in place, markets widely expect the Fed to continue tightening through 2022 and likely into 2023.

Target and Walmart Harbinger

Target (TGT) and Walmart (WMT) warned that profits would take a hit from an inventory glut. Microsoft (MSFT) also issued a profit warning and said that revenue would be softer than expected due to unfavorable foreign exchange rates. Strategists say they expect to see more companies issuing profit warnings.

Inventories at some retailers have been building, as consumer demand shifted to different categories as Covid cases fell and consumers returned to social events and other activities. Higher costs also play a role, especially as consumers are pinched by record-high gasoline and rising food prices.

These profit warnings are two-fold:

1) margins will be squeezed by reduced demand and a stronger dollar
2) this may signal the peak of the inflation cycle via inventory glut and rising interest rates.

The former will take time to flow through quarterly earnings, while the latter may finally spur this bear market.

The Importance of CPI

The CPI is an important economic readout as this is a measure of price changes in a basket of consumer goods and services used to identify periods of inflation. Mild inflation can encourage economic growth and stimulate business investment and expansion.

High inflation reduces the buying power of the dollar and can reduce demand for goods and services. High inflation also drives interest rates higher while driving bond prices lower. By comparing the current cost of buying a basket of goods with the cost of buying the same basket a year ago indicates changes in the cost of living.

Thus, the CPI figure measures the rate of increase or decrease in a broad range of prices (i.e. food, housing, transportation, medical care, clothing, electricity, entertainment and services). As CPI numbers rage on and remain elevated, the Federal Reserve must act aggressively to tame inflation.

The CPI readings will become even more important moving forward and have directly impacted market movements and overall sentiment. These CPI reports are becoming more significant as the more robust CPI readings will translate into a stronger influence on the Federal Reserve's monetary policies and downstream interest rate hikes.

The Federal Reserve has reached an inflection point to where they were forced to curtail their stimulative easy monetary policies as inflation, unemployment and overall economy improved. Investors can expect increased volatility as these critically important CPI reports continue to be released through the remainder of 2022.

Conclusion

Inflation pushed higher in May as prices rose 8.6% from a year ago for the fastest increase in nearly 40 years. Both CPI and core CPI exceeded estimates and came in hotter than expected. The Consumer Price Index (CPI) has become the most influential and critical variable in today's market. The CPI readings directly impact monetary policy put forth by Federal Reserve via interest rate hikes, bond buying, and liquidity measures. The impact of inflation is now flowing through to companies and consumers, with Target and Walmart issuing profit warnings.

The confluence of rising interest rates, inflation, China Covid lockdowns and the war in Ukraine has resulted in months of selling. The relentless, indiscriminate selling has pushed the Dow Jones and S&P 500 deep into correction territory while pushing the Nasdaq deep into a bear market.

As such, the market appears to be factoring in a worst-case scenario that may result in a Federal Reserve induced recession as a function of over-tightening on monetary policy and/or its inability to combat inflation responsibly to engineer an economic "soft landing". The overall market is in a precarious position, and it'll likely take successive downward CPI readings before rates will stabilize and the markets can appreciate higher.

However, these profit warnings' silver lining may signal the inflation cycle's peak via an inventory glut and rising interest rates. If this signals that inflation has peaked, then rates may normalize, and the market can appreciate higher over the long term.

Disclosure: Stock Options Dad LLC is a Registered Investment Adviser (RIA) firm specializing in options-based services and education. There are no business relationships with any companies mentioned in this article. This article reflects the opinions of the RIA. Any recommendation contained in this article is subject to change at any time. No recommendation is intended to constitute an entire portfolio. The author encourages all investors to conduct their own research and due diligence prior to investing or taking any actions in options trading. Please feel free to comment and provide feedback; the author values all responses. The author is the founder and Managing Member of Stock Options Dad LLC – A Registered Investment Adviser (RIA) firm www.stockoptionsdad.com defining risk, leveraging a minimal amount of capital and maximizing return on investment. For more engaging, short-duration options-based content, visit Stock Options Dad LLC’s YouTube channel. Please direct all inquires to [email protected]. The author holds shares of AAPL, ACN, ADBE, AMD, AMZN, ARKK, AXP, BA, BBY, C, CMG, CRM, DIA, DIS, FB, FDX, FXI, GOOGL, GS, HD, HON, IBB, INTC, IWM, JPM, MA, MS, MSFT, NKE, NVDA, PYPL, QCOM, QQQ, SBUX, SPY, SQ, TMO, and V.