With fast and furious rate hikes yet to succeed in bringing inflation under control, the stock market is expected to witness further volatility. However, the energy sector remains well-positioned to thrive with tight supply and rising global demand pushing oil prices higher.
While OPEC+’s decision to cut oil production by 2 million barrels/day and limited availability of Russian oil will keep supply tight, OPEC expects global oil demand to increase to 103 million barrels per day (BPD) next year.
Besides being the relatively cleaner alternative among fossil fuels, the natural gas liquid market is set to grow at 5.7% CAGR to reach $29 billion by 2030. Hence, it would be opportune to capitalize on the industry tailwinds and load up on oil and gas stocks Diamondback Energy, Inc (FANG) and Baker Hughes Company (BKR) as some technical indicators point to solid upsides.
Diamondback Energy, Inc (FANG)
FANG is an independent oil and gas company with a market capitalization of $34.89 billion. The company is involved in acquiring, developing, exploring, and exploiting unconventional, onshore oil and natural gas reserves in the Permian Basin in West Texas. It operates through two segments: the upstream segment and the midstream operations segment.
Over the last three years, FANG’s revenue grew at a 44% CAGR, while its EBITDA grew at 41.7% CAGR. Over the same time horizon, the company’s net income grew at a 67.2% CAGR.
During the third quarter of the fiscal year 2022, ended September 30, FANG’s total revenues increased 27.6% year-over-year to $2.44 billion. During the same period, the company’s income from operations increased 38.7% year-over-year to $1.61 billion, while its adjusted EBITDA increased 68.2% year-over-year to $1.91 billion.
FANG’s adjusted net income for the quarter came in at $1.14 billion or $6.48 per share. Due to high cash margins, and best-in-class well costs, the company generated nearly $1.2 billion in free cash flow, of which it returned around 75% to shareholders through share repurchases and dividend payouts.
Analysts expect FANG’s revenue and EPS for the fiscal year ending December 2022 to increase 42.4% and 120.1% year-over-year to $9.68 billion and $24.80. The company has surpassed consensus EPS estimates in each of the trailing four quarters.
FANG is trading at a discount compared to its peers, indicating further upside potential for the stock. In terms of forward P/E, FANG is presently trading at 6.51x, 18.7% lower than the industry average of 8x. Also, it is trading at a forward EV/EBITDA multiple of 4.9, compared to the industry average of 5.81.
The stock is currently trading above its 50-day and 200-day moving averages of $138.32 and $133.16, respectively, indicating an uptrend. It has gained 15.3% over the past month and 48.9% year-to-date to close the last trading session at $163.49.
MarketClub’s Trade Triangles show that FANG has been trending UP for all three time horizons. The long-term and intermediate-term trends for FANG have been UP since October 6, 2022, while its short-term trends have been UP since October 31, 2022.
The Trade Triangles are our proprietary indicators, comprised of weighted factors that include (but are not necessarily limited to) price change, percentage change, moving averages, and new highs/lows. The Trade Triangles point in the direction of short-term, intermediate, and long-term trends, looking for periods of alignment and, therefore, strong swings in price.
In terms of the Chart Analysis Score, another MarketClub proprietary tool, FANG scored +90 on a scale from -100 (strong downtrend) to +100 (strong uptrend), indicating that the uptrend is likely to continue. While FANG shows intraday weakness, it remains in the confines of a bullish trend. Traders should use caution and utilize a stop order.
The Chart Analysis Score measures trend strength and direction based on five different timing thresholds. This tool takes into account intraday price action, new daily, weekly, and monthly highs and lows, and moving averages.
Click here to see the latest Score and Signals for FANG.
Baker Hughes Company (BKR)
BKR is an energy technology company with a market capitalization of $29.36 billion. The company operates through three segments: Oilfield Services (OFS); Oilfield Equipment (OFE); Turbomachinery & Process Solutions (TPS); and Digital Solutions (DS). BKR’s revenue grew at a 6.8% CAGR over the past five years.
For the fiscal 2022 third quarter, ended September 30, 2022, BKR’s revenue increased 5.4% year-over-year to $5.37 billion. During the same period, driven by higher volume and pricing with all segments expanding their margins, the company’s adjusted operating income and adjusted EBITDA increased 25.1% and 14.2% year-over-year to $503 million and $758 million, respectively.
The adjusted net income attributable to BKR for the quarter came in at $264 million or $0.26 per share, up 87.2% and 62.5% year-over-year, respectively.
Analysts expect BKR’s revenue and EPS for the fiscal year ending December 2022 to increase 4% and 45.7% year-over-year to $21.36 billion and $0.92, respectively. Both metrics are expected to keep growing over the next two fiscals.
In terms of forward P/E, BKR is currently trading at 31.72x compared to the industry average of 8x. However, its forward Price/Sales multiple of 1.36 compares to the industry average of 1.49.
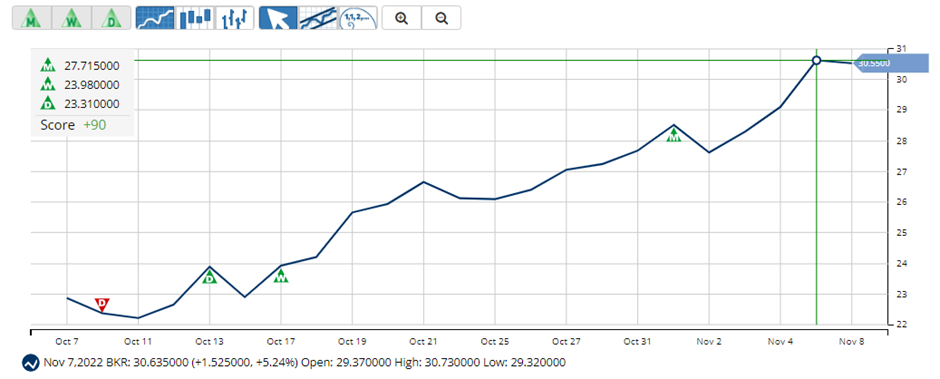
BKR’s stock is currently trading above its 50-day and 200-day moving averages of $24.48 and $29.35, respectively, indicating a bullish trend. It has gained 32.6% over the past month to close the last trading session at $30.62.
MarketClub’s Trade Triangles show that BKR has been trending UP for all three time horizons. The long-term trend for BKR has been UP since November 1, 2022, while its intermediate and short-term trends have been UP since October 17 and October 13, 2022, respectively.
In terms of the Chart Analysis Score, BKR scored +90 on a scale from -100 (strong downtrend) to +100 (strong uptrend), indicating that the uptrend is likely to continue. While BKR shows intraday weakness, it remains in the confines of a bullish trend. Traders should use caution and utilize a stop order.


