
Recent data suggests that the U.S. economy has been more resilient than expected, despite the Fed’s efforts to cool it down through monetary tightening. However, the market widely expects the central bank to implement a lower rate hike in its meeting this month.
However, many economists believe that the terminal interest rates will beat the earlier estimates. This might tighten fund availability for growing businesses while softening consumer demand in the year ahead.
Hence it would be safe to bet on stocks with an encouraging outlook while avoiding the weak ones.
Given its strong trends, it could be wise to buy NVIDIA Corporation (NVDA) to capitalize on increased consumer spending on electronics during holidays. On the other hand, CrowdStrike Holdings, Inc. (CRWD) might be best avoided now, given its downtrend.
NVIDIA Corporation (NVDA)
NVDA is a global provider of graphics, computation, and networking solutions. The company operates through two segments: Graphics and Compute & Networking.
NVDA’s revenue has exhibited a 41.8% CAGR over the past three years. During the same time horizon, the company’s EBITDA and net income have also grown at 51.6% and 35.2% CAGRs, respectively.
For the fiscal third quarter, ended October 30, 2022, NVDA’s non-GAAP operating income increased 15.9% sequentially to $1.54 billion, while its non-GAAP net income came in at $1.46 billion, up 12.7% quarter-over-quarter. This resulted in a sequential increase of 13.7% in non-GAAP EPS to $0.59 during the same period.
Analysts expect NVDA’s revenue and EPS for the fiscal fourth quarter to increase 1.5% and 37.9% sequentially to $6.02 billion and $0.80, respectively. The company has surpassed consensus EPS estimates in two of the trailing four quarters.
Owing to its strong performance and solid growth prospects, NVDA is currently commanding a premium valuation compared to its peers. In terms of forward P/E, NVDA is currently trading at 48.89x compared to the industry average of 19.35x. Also, its forward EV/EBITDA multiple of 65.13 is higher than the industry average of 12.75.
The stock is currently trading above its 50-day and below its 200-day moving averages of $139.16 and $176.47, respectively, indicating an uptrend. It has gained 13.7% over the past month to close the last trading session at $159.87.
MarketClub’s Trade Triangles show that NVDA has been trending UP for two of the three-time horizons. Its long-term trend has been UP since December 1, 2022, while its intermediate-term trend has been UP since October 27, 2022.
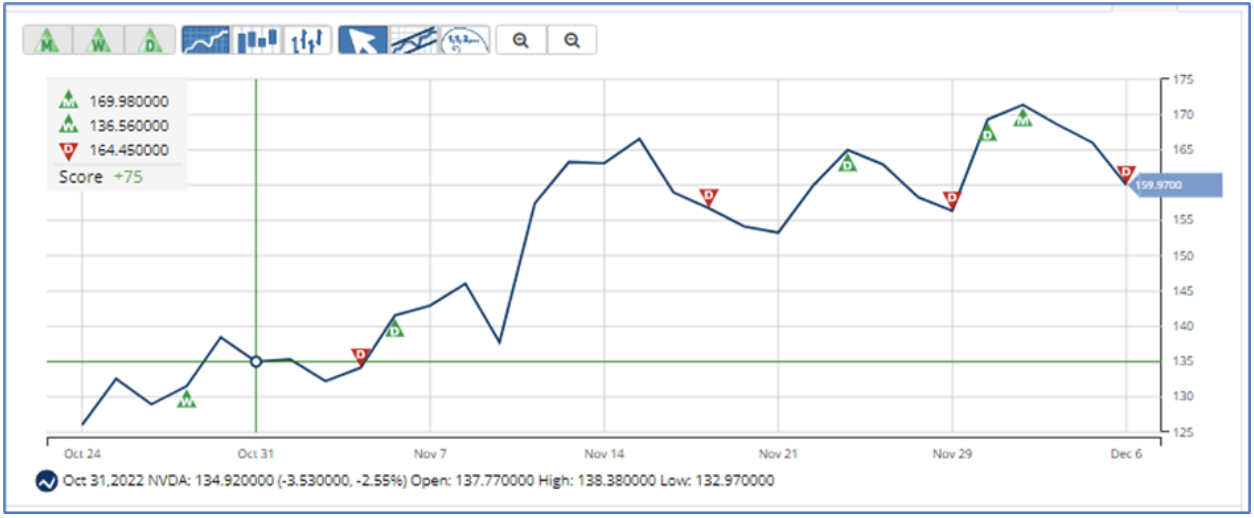
The Trade Triangles are our proprietary indicators, comprised of weighted factors that include (but are not necessarily limited to) price change, percentage change, moving averages, and new highs/lows. The Trade Triangles point in the direction of short-term, intermediate, and long-term trends, looking for periods of alignment and, therefore, strong swings in price.
In terms of the Chart Analysis Score, another MarketClub proprietary tool, NVDA scored +85 on a scale from -100 (strong downtrend) to +100 (strong uptrend), indicating that a longer-term bullish trend could resume. Traders should continue to monitor the trend score and utilize a stop order.

The Chart Analysis Score measures trend strength and direction based on five different timing thresholds. This tool takes into account intraday price action, new daily, weekly, and monthly highs and lows, and moving averages.
Click here to see the latest Score and Signals for NVDA.
CrowdStrike Holdings, Inc. (CRWD)
CRWD offers solutions and workload protection for endpoints over the cloud via a software-as-a-service (SaaS) subscription-based model. The company’s Falcon platform delivers integrated technologies that provide security and performance while reducing customer complexity.
For the third quarter of the fiscal year 2023, ended October 31, 2022, CRWD’s loss from operations widened 40.1% year-over-year to $56.42 million, while its net loss widened 8.3% year-over-year to $54.63 million. The company’s total liabilities stood at $3.13 billion as of October 31, 2022, compared to $2.58 billion as of January 31, 2022.
In terms of forward P/E, CRWD is currently trading at 75.67x, significantly higher than the industry average of 19.35x. The company’s forward EV/Sales multiple is 11.67, compared to the industry average of 2.63. Also, its forward Price/Sales multiple of 11.95 compares unfavorably to the industry average of 2.52.
Despite its frothy valuations, CRWD’s stock is currently trading below its 50-day and 200-day moving averages of $149.17 and $176.15, respectively, indicating a bearish trend. It has slumped 10% over the past month and 42.6% year-to-date to close the last trading session at $113.83.
MarketClub’s Trade Triangles show that CRWD has been trending DOWN for all three-time horizons. The long-term trend for CRWD has been DOWN since May 9, 2022. Its intermediate-term and short-term trends have been DOWN since August 31 and November 17, respectively.

In terms of the Chart Analysis Score, CRWD scored -90 on a scale from -100 (strong downtrend) to +100 (strong uptrend), indicating a strong downtrend that is likely to continue. Traders should use caution and set stops.

Click here to see the latest Score and Signals for CRWD.
What's Next for These Tech Stocks?
Remember, the markets move fast and things may quickly change for these stocks. Our MarketClub members have access to entry and exit signals so they'll know when the trend starts to reverse.
Join MarketClub now to see the latest signals and scores, get alerts, and read member-exclusive analysis for over 350K stocks, futures, ETFs, forex pairs and mutual funds.
Best,
The MarketClub Team
su*****@in*.com
What we need is % rates at 5%, A 70% drop in Real Estate and a 75% drop in the Dow.
A move back down to Dow 1000 would be great and deserving. That's right 1000 !!!!!!