
Last year, the automotive industry’s growth was hampered by macroeconomic challenges, including rising interest rates, material inflation, and continued supply chain issues.
Industry estimates of new vehicles sold in the united states in 2022 range from 13.7 million to 13.9 million, representing a decline of roughly 8% to 9% from the 2021 level and the lowest level since 2011.
However, auto industry executives are cautiously optimistic about a rebound in new vehicle sales in 2023. Toyota Motor Corp (TM) expects U.S. auto sales to grow 9% from the previous year to about 15 million this year. Also, S&P Global Mobility and Edmunds project new vehicle sales to be 14.8 million, while Cox Automotive’s preliminary forecast is around 14.1 million.
Moreover, consumer spending remained strong in the first month of 2023. The Commerce Department reported last Wednesday that retail sales grew by 3% in January, exceeding the estimate of a 1.9% increase. A significant jump in auto sales primarily drove the gain in retail sales.
Furthermore, sustained demand for electric vehicles (EVs) should boost the auto industry’s growth. U.S. EV sales leaped by two-thirds over the past year. According to year-end figures released by market research firm Motor Intelligence, automakers sold approximately 807,180 fully electric vehicles (EVs) in the United States in 2022, up 3.2% year-over-year.
Based on a report by Contrive Datum Insights Pvt Ltd, the global electric vehicle market is projected to reach over $1.10 trillion by 2030, growing at a CAGR of 23.1%.
Given the promising prospects, it could be wise to take advantage of the uptrend in auto stocks General Motors Company (GM), Stellantis N.V. (STLA), and Honda Motor Co., Ltd. (HMC) for outsized returns this year.
General Motors Company (GM)
With a $60.21 billion market cap, GM designs, markets, and sells trucks, cars, and automobile parts worldwide. Additionally, it offers financing and insurance services; and software-enabled services and subscriptions. The company operates through four segments: GM North America; GM International; Cruise; and GM Financial. It markets its vehicles under Buick, Baojun, Chevrolet, and Wuling brand names.
Over the last three years, GM’s revenue and EBITDA have grown at CAGRs of 4.5% and 11.8%, respectively, while the company’s net income has grown at 13.85% CAGR. Also, its EPS and total assets have increased at CAGRs of 10.3% and 19.9%, respectively.
In the fiscal fourth quarter that ended December 31, 2022, GM’s revenue increased 28.4% year-over-year to $43.11 billion. The company’s adjusted EBIT totaled $3.80 billion, up 33.8% year-over-year. Net income attributable to stockholders was $2 billion, an increase of 14.8% year-over-year. In addition, its adjusted EPS grew 57% from the prior-year period to $2.12.
Analysts expect GM’s revenue for the second quarter (ending June 2023) to come in at $40.13 billion, representing an increase of 12.2% year-over-year. Also, the consensus EPS estimate of $1.61 for the next quarter indicates a 41.4% year-over-year increase. Moreover, the company has surpassed the consensus EPS estimates in three of the trailing four quarters.
GM’s trailing-12-month EBITDA margin of 11.37% is 2.5% higher than the industry average of 11.09%. Its trailing-12-month net income margin of 6.34% is 31.7% higher than the 4.81% industry average. Also, the stock’s trailing-12-month ROCE of 13.98% compares to the industry average of 12.47%.
GM is currently trading at a discount to its industry peers. In terms of forward non-GAAP P/E, the stock is trading at 6.99x, 53% lower than the industry average of 14.88x. And its forward EV/Sales of 0.95x is 22.9% lower than the 1.23x industry average. In addition, its forward Price/Sales and Price/Cash Flow of 0.37x and 3.99x compare to the industry averages of 0.96x ad 10.83x, respectively.
The stock is currently trading above its 50-day and 200-day moving averages of $37.64 and $36.96, respectively, indicating an uptrend. It has gained 17.5% over the past month and 12.4% over the past six months to close the last trading session at $43.17.
MarketClub's Trade Triangles show that GM has been trending UP for all the three-time horizons. The long-term trend for GM has been UP since September 9, 2022, while its intermediate-term and short-term trends have been UP since January 9, 2023, and February 15, 2023, respectively.
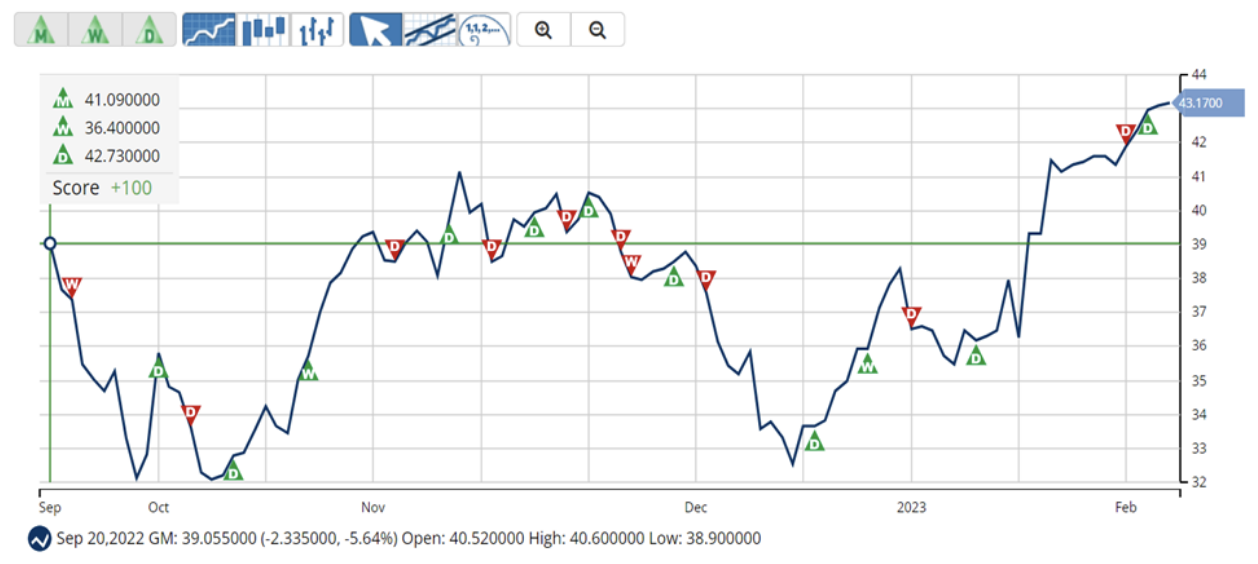
The Trade Triangles are our proprietary indicators, comprised of weighted factors that include (but are not necessarily limited to) price change, percentage change, moving averages, and new highs/lows. The Trade Triangles point in the direction of short-term, intermediate, and long-term trends, looking for periods of alignment and, therefore, intense swings in price.
In terms of the Chart Analysis Score, another MarketClub proprietary tool, GM scored +100 on a scale from -100 (strong downtrend) to +100 (strong uptrend), indicating that the strong uptrend will likely continue. Traders should protect gains and look for a change in score to suggest a slowdown in momentum.

The Chart Analysis Score measures trend strength and direction based on five different timing thresholds. This tool takes into account intraday price action, new daily, weekly, and monthly highs and lows, and moving averages.
Click here to see the latest Score and Signals for GM.
Stellantis N.V. (STLA)
Headquartered in Hoofddrop, the Netherlands, STLA designs, engineers, manufactures, and sells automobiles and light commercial vehicles, transmission systems, engines, metallurgical products, and production systems globally.
The company provides its products under the Abarth, Alfa Romeo, Chrysler, DS, Fiat, Jeep, Opel, Lancia, Teksid, and Comau brand names. It has a market capitalization of $55.56 billion.
STLA’s revenue has grown at a CAGR of 30.7% over the last three years. Also, over the same period, its net income and EPS have increased at CAGRs of 69.2% and 12.9%, respectively, while its total assets have grown at 53.7% CAGR.
For the fiscal third quarter ended September 30, 2022, STLA reported net revenues of €42.10 billion ($44.98 billion), a 29% increase year-over-year, primarily reflecting higher volumes, continued strong net pricing, and favorable FX translation effects. Its consolidated shipments of 1,281,000 units, up 13% year-over-year, mainly due to improved semiconductor order fulfillment. Also, global BEV sales grew 41% compared to the third quarter of 2021.
Analysts expect STLA’s revenue for the to-be-reported year (ended December 2022) to come in at $188.58 billion, representing an increase of 9.7% year-over-year. Also, the consensus revenue estimate of $192.53 billion for the current fiscal year 2023 indicates a 2.1% year-over-year increase.
Moreover, the company has topped the consensus revenue estimates in each of the trailing four quarters, which is impressive.
STLA’s trailing-12-month EBIT margin of 11.68% is 46.8% higher than the industry average of 7.96%. And the stock’s trailing-12-month EBITDA and net income margin of 14.21% and 9.33% compare to the industry averages of 11.09% and 4.81%, respectively. Also, its levered FCF margin of 5.99% is 341.6% higher than the 1.36% industry average.
In terms of forward non-GAAP P/E, STLA is currently trading at 3.19x, 78.6% lower than the industry average of 14.88x. The stock’s forward EV/EBITDA of 1.15x is 88.5% lower than the 9.96x industry average. Likewise, its forward Price/Sales of 0.29x is 69.6% lower than the industry average of 0.96x.
STLA has gained 11.6% over the past month and 15.3% over the past six months to close the last trading session at $17.29. The stock is currently trading above its 50-day and 200-day moving averages of $15.34 and $14.08, respectively, indicating an uptrend.
According to MarketClub’s Trade Triangles, STLA has been trending UP for all the three-time horizons. The stock’s long-term and intermediate-term trends have been UP since November 30, 2022, and January 4, 2023, respectively. Moreover, the short-term trend for STLA has been UP since January 26, 2023.
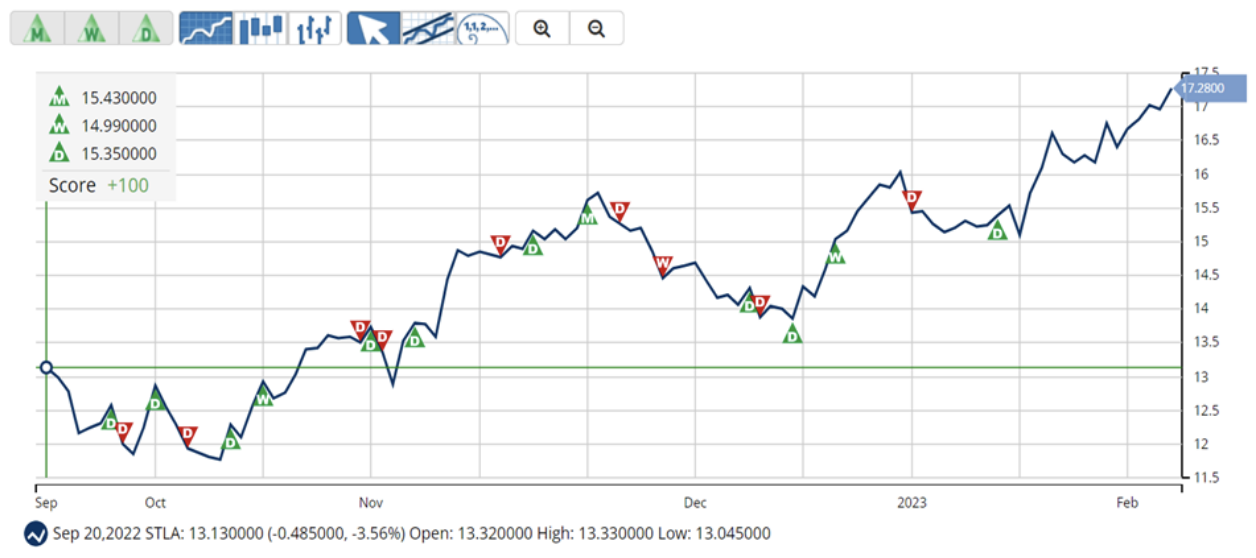
In terms of the Chart Analysis Score, STLA scored +100 on a scale from -100 (strong downtrend) to +100 (strong uptrend). The stock is in a strong uptrend that is likely to continue. As usual, investors should protect gains and look for a change in score to suggest a slowdown in momentum.
Click here to see the latest Score and Signals for STLA.
Honda Motor Co., Ltd. (HMC)
With a $43.17 billion market cap, HMC manufactures and distributes motorcycles, power products, automobiles, and other products in Japan, North America, Europe, Asia, and internationally.
The company operates through four segments: Motorcycle Business; Automobile Business; Financial Services Business; and Life Creation and Businesses. It is headquartered in Tokyo, Japan.
HMC’s EBITDA has grown at a CAGR of 16.9% over the last three years. Also, its net income and EPS have grown at CAGRs of 14.5% and 15.6% over the same period, respectively.
For the fiscal 2023 third quarter ended December 31, 2022, HMC’s revenue increased 20.3% from the year-ago value to ¥4.44 trillion ($33.09 billion). The increase in revenue was driven by higher sales in the motorcycle business and an increase in currency effects. The company’s operating profit was ¥280.40 billion ($2.09 billion), up 22.2% year-over-year, mainly due to profit increase from sales impacts and currency effects.
Also, HMC’s profit before income taxes grew 20.6% from the prior-year quarter to ¥343.50 billion ($2.56 billion). Profit for the period attributable to owners of the parent increased 26.8% year-over-year to ¥244.60 billion ($1.82 billion), while EPS attributable to owners of the parent was ¥144.42, an increase of 32.1% year-over-year.
Analysts expect HMC’s revenue and EPS of $126.60 billion and $3.27 for the current fiscal year (ending March 2023), indicating increases of 374% and 2.3% year-over-year, respectively. Furthermore, the company has surpassed the consensus revenue estimates in three of the trailing four quarters.
HMC’s trailing-12-month EBITDA margin of 13.80% is 24.4% higher than the industry average of 11.09%. Likewise, the stock’s levered FCF margin of 8.41% is 520.3% higher than the 1.36% industry average.
In terms of forward EV/Sales, HMC is currently trading at 0.59x, 52% lower than the industry average of 1.23x. The stock’s forward EV/EBITDA of 7.27x is 27% lower than the 9.96x industry average. Also, its forward Price/Cash Flow of 2.49x compares to the industry average of 10.83x.
The stock has gained 6.3% over the past month to close the last trading session at $25.54. It is currently trading above its 50-day and 200-day moving averages of $24.06 and $24.42, respectively, indicating an uptrend.
MarketClub's Trade Triangles show that HMC has been trending UP for all the three-time horizons. The long-term trend for HMC has been UP since January 31, 2023, while its intermediate-term and short-term trends have been UP since January 9, 2023, and February 10, 2023, respectively.
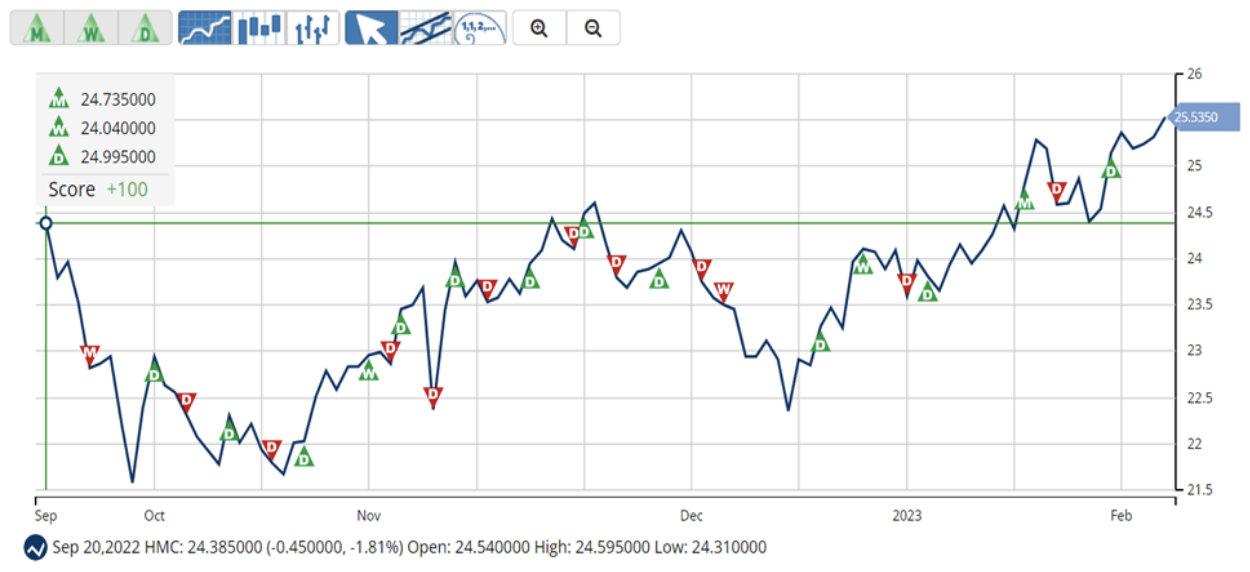
In terms of the Chart Analysis Score, HMC scored +100 on a scale from -100 (strong downtrend) to +100 (strong uptrend), indicating that the uptrend is likely to continue. Traders should protect gains and look for a change in score to suggest a slowdown in momentum.
Click here to see the latest Score and Signals for HMC.
What's Next for These Auto Stocks?
Remember, the markets move fast and things may quickly change for these stocks. Our MarketClub members have access to entry and exit signals so they'll know when the trends starts to reverse.
Join MarketClub now to see the latest signals and scores, get alerts, and read member-exclusive analysis for over 350K stocks, futures, ETFs, forex pairs and mutual funds.
Best,
The MarketClub Team
su*****@in*.com