
Almost four years ago, I wrote about the supremacy of palladium over platinum, and we watched the Platinum/Palladium ratio fall below its long-term valley of 0.56 oz.
In contrast, today the Platinum/Palladium ratio is approaching a 4-year high of 0.7 oz, marking a doubling from its all-time low of 0.31 oz established in 2020.
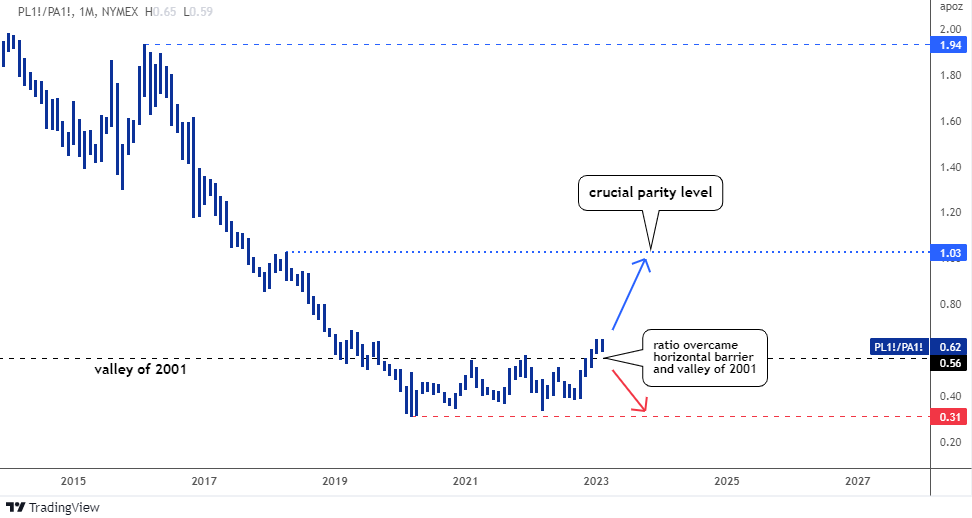
On its way up, the ratio broke through a double barrier that included the 2001 valley of 0.56 oz and the horizontal resistance at the top of the range. There are no other barriers for the ratio until it reaches parity between the two metals, which will be a crucial resistance level.
This is because palladium was replaced with the cheaper platinum in the automobile industry due to palladium's abnormally expensive price.
It is estimated that the platinum substitution of palladium reached 340 koz in 2022, and it is predicted to increase to over 500 koz in 2023, more than twice the amount in 2021.
In other news, the EU has approved a law prohibiting the sale of new petrol and diesel cars that emit carbon from 2035 onwards. The law aims to speed up the transition to electric vehicles. With these factors in play, it seems likely that the two metals will reach parity.
Despite the promising outlook, we should not discount the possibility of the ratio falling back into the 0.31-0.56 oz range if it drops below its previous resistance level.
Let us move to a daily chart of platinum below.
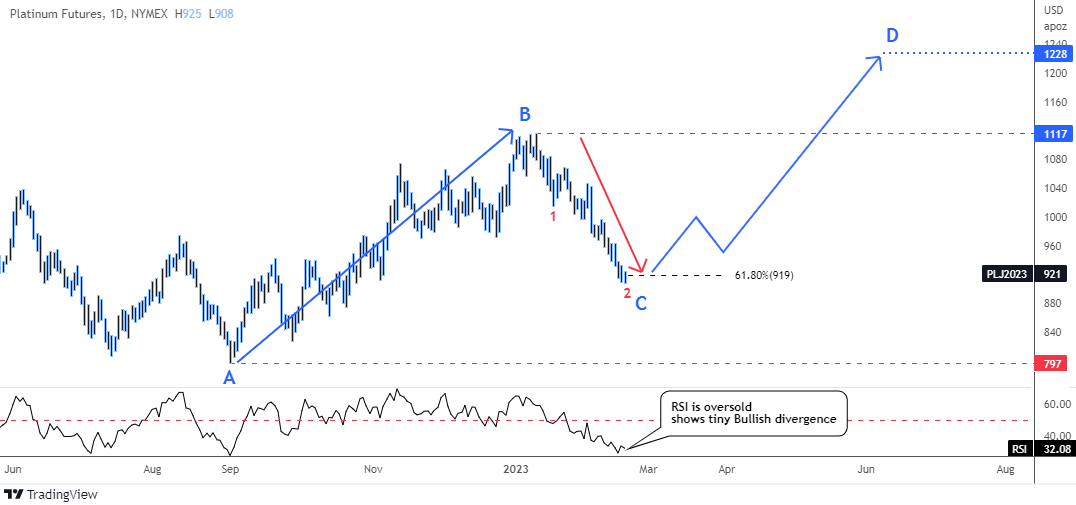
Platinum futures have fallen below the 61.8% Fibonacci retracement level of $919, which is known as the "golden cut" ratio.
If this is viewed as a correction (red down arrow) after an impulsive move (AB segment), then the current level could be an attractive buy point as it's a common retracement bottom.
The correction has two clear red legs down (1, 2), the last one is longer than the first one.
The RSI indicator is oversold, and there is a small Bullish Divergence as it didn't make a lower valley with the price.
The blue zigzag represents a potential path for the CD segment, with a target of $1,228, where CD is equal in length to AB. A conservative approach implies waiting for the small correction after an initial minor move up, which shouldn’t break below the most recent low marked as C point.
The $1,117 level will serve as a key resistance point at the B level, while the $797 level will act as crucial support at the A level.
World Platinum Investment Council projects that “this year is forecast to be the second strongest year for industrial platinum demand on record, despite the challenging economic conditions that are prevailing. Indeed, demand is expected to climb ten per cent to 2,316 koz, with a notable increase in demand from the glass industry.”
Let us get down to palladium futures.
Last October, I posted an update on the palladium futures chart, which showed the metal's price forming a Bear Flag pattern. I put the old chart below to refresh your memory.
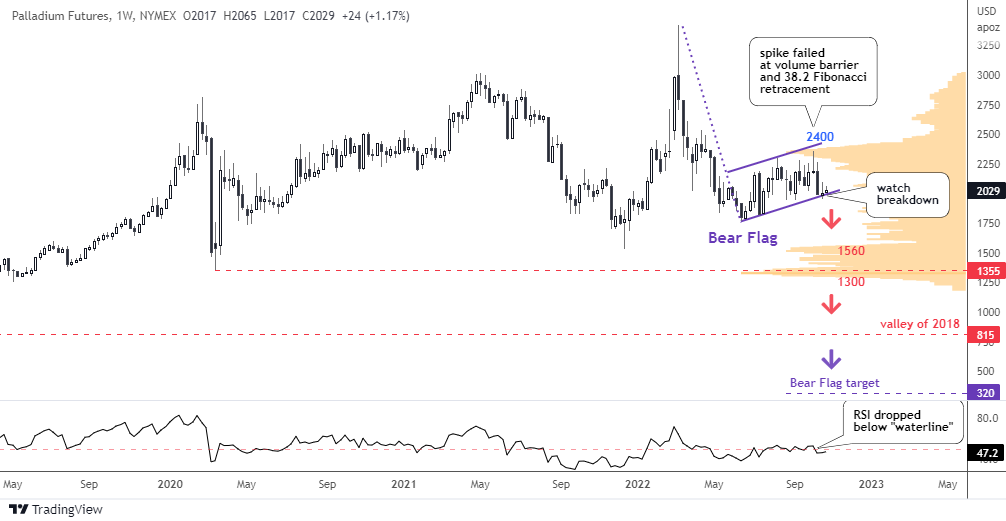
Indeed, the Bear Flag played out well, causing the price to drop significantly by more than $600 and breaking below the first support level at $1,560, and approaching the next one at $1,355. I see the latter as a crucial point as you can see in the next monthly chart.
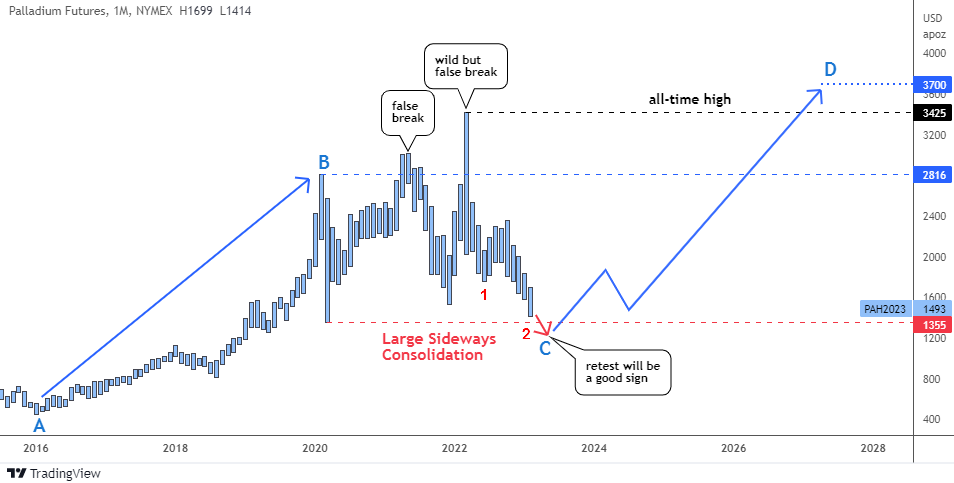
Palladium futures show huge volatility in the chart since 2019. We had ups and downs of a strong magnitude that continue with a huge drop.
The large consolidation pattern has continued until the present, with two false upside breaks in the chart.
We may currently be in the last big leg down of a large sideways consolidation that has been ongoing since 2019.
This final leg consists of two smaller parts, with the second part projected to reach 61.8% of the first part when it hits the valley of the initial move down at $1,355. This represents a significant confluence of technical analysis factors.
The retest of that valley would be a good sign that the pattern is complete and could potentially attract buyers. If this scenario plays out, the potential for a bullish reversal is significant. The projected CD segment could reach around $3,700, nearly tripling the current price.
It's best to wait for a small correction after an initial move up, but make sure it doesn't break below the most recent low on the chart.
There are three key levels that may serve as resistance for the palladium futures as they move higher.
The first is a minor barrier at the top of the second smaller part of the current downtrend, which is located at $2,360. The second level is the B point at $2,816, which represents a stronger resistance. Finally, the all-time high at $3,425 is expected to be the toughest level to break through.
Intelligent trades!
Aibek Burabayev
INO.com Contributor
Disclosure: This contributor has no positions in any stocks mentioned in this article. This article is the opinion of the contributor themselves. The above is a matter of opinion provided for general information purposes only and is not intended as investment advice. This contributor is not receiving compensation (other than from INO.com) for their opinion.