
Last month I updated the Bitcoin chart after this cryptocurrency made a buzz at the end of the June pushing through $13,000. In the same post, I shared with you the 4-hour chart where the horizontal consolidation had been spotted. The Bitcoin price was at the $11,500 level then, and I expected it to drop lower to complete the correction.
Let’s see below what you were waiting for Bitcoin then.
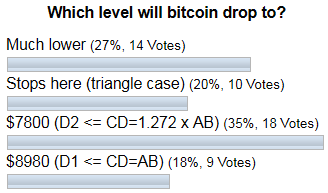
The majority of you expected Bitcoin to drop to the $7,800. Bitcoin haters were second to see head much lower. And the fans were in the third place with an immediate reversal option (stops here).
So far the least liked option of CD=AB at the $8,980 was the most accurate prediction as the Bitcoin indeed dropped lower but only to the $9,071. I think that time emotions were above the calm mind as the 5-digit price tag of the crypto spurred both euphoria and hatred as opinions were divided.
These days it is more important that the price of the buzz maker is still below that top of $13,850. 55 days passed since the former maximum was established. 34 days expired since the crypto completed the anticipated structure. The main coin is running out of time as it is ticking against him. I prepared for you an updated in the daily chart below.
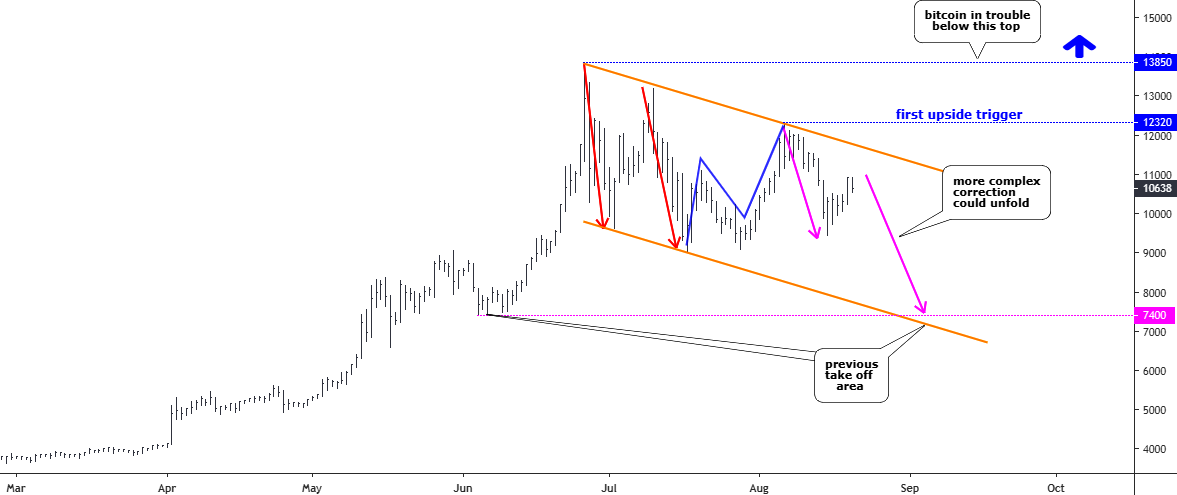
Chart courtesy of tradingview.com
Bitcoin has made a try to push through the top of the second leg (second red down arrow) of a correction beyond the $13,200, but the maximum it could squeeze was the lower top of $12,320 on the 6th of August. The next move wasn’t in the same direction as the price dropped, losing almost all gains down to the $9,500 area. This was a bad sign then.
It looks like we might have a very complex correction unfolding soon. For visual comfort, I labeled different crucial parts of it with separate colors. The anticipated correction is labeled with two red down arrows. The linking corrective structure is highlighted with a blue zigzag. Now we get down to the interesting part of the structure. I think that massive drop from the $12,320 down to the $9,500 was the first move of the second part of a correction, so I marked it with a new purple color. Another anticipated drop highlighted with the other purple down arrow should follow. I am not sure if the small linking correction between them is done.
I contoured the whole structure, including the unfolding second part with the orange downtrend channel. It clearly shows the angle of the current consolidation, and it points at the possible completion area around the $7,200 level. It perfectly fits with the price area of the earlier take-off at the $7,400.
It took the main coin 193 days to rocket from the low of $3,100 area (December 2018) up to the former top of $13,850 (June 2019). And the current correction took only 55 days. The second move from the second part could add some more days. It looks like the continuation rally has been postponed, so be careful. In the worst-case scenario, there could be another extension with the third part of a correction with even deeper retracement, but it is not visible yet.
The first upside trigger is located at the apex of the blue zigzag at the $12,320. But the main confirmation should come with the break of the former top above the $13,850.
Intelligent trades!
Aibek Burabayev
INO.com Contributor, Metals
Disclosure: This contributor has no positions in any stocks mentioned in this article. This article is the opinion of the contributor themselves. The above is a matter of opinion provided for general information purposes only and is not intended as investment advice. This contributor is not receiving compensation (other than from INO.com) for their opinion.