How low can the DOW go?

Make no mistake about it, the market action on Wednesday (November 19th) was extremely negative for all of the indices that we track. The close below 8,000 on the DOW can only be described as negative, indicating further weakness to the downside. I am looking for this index to trade down to around the 6600-6700 level.

Watch my new video right here.

Looking at the charts using our "Trade Triangle" technology, it is clear that the Dow has been under pressure since our first major sell signal at 11,290. I see no reason to alter this stand, as I believe the trend will continue to be on the downside. I expect to see further weakness in the weeks and months to come.
What's an investor to do? As a trader or investor there are three choices you have as an investor:

1. You can go long a market.
2. You can go short a market.
3. You can move into cash.

I'm often amused when I see people buying "defensive stocks." Why not get out of the market entirely when it's going down. Doesn't that make common sense to everyone?

However, most brokers want you to stay in the market at all times fearing that they will miss a bottom. Truth is, most investors (including brokers) missed the top, so what makes anyone so sure that they'll catch the bottom?
The key in trading is not to get out at the top, or in at the bottom. Anyone who tells you to do that isn't playing smart in the markets, and most likely claims that they are holding the "holy grail" of trading.

An investor's goal should be to capture 70% of a move. The middle is the sweet spot, and if you make enough in the middle then who cares about the tops and bottoms.  Forget picking up the 15% on the top and 15% on the bottom, it doesn't work consistently to use it as a trading strategy.

Check out my new video and see exactly where we got out of the indexes and were we see them headed right now...

Enjoy the video,

Adam Hewison
President, INO.com
Co-creator, MarketClub

Traders Toolbox: Money Management - Part 1 of 4

Crucial but often overlooked, money management practices can mean the difference between winning and losing in the markets.
Plenty of books, manuals, and software packages will help you form and opinion of a market, but not many will tell you how to trade once you have decided to get long or short. The goal of money management is to increase the odds of high quality trades. And as we'll see, leaving the money management variable out of your trading equation can lead to ruin, even if you're correct about the market direction.


In a broad sense, money management can encompass those elements of trading outside the initial decision to get long or short in a given market or markets – that is, how many positions to put on, when to get out, where to place protective stops. More specifically, it refers to the strategic allocation of capital to limit risk and optimize trading performance in the long run. Allocation of capital can refer to how much money to put into any one market or how much money to risk on any one trade. These decision directly affect how many positions to put on and where to place stop orders.
Given the negative odds inherent in trading (a successful trader can expect to lose money on 60% of his trades), how do you go about maximizing the profit potential of the few winning trades you can expect to have? The answers vary with the disposition and trading style of the individual trader. There exist, however, basic concepts that can be successfully adapted and modified to individual needs, and when the followed in spirit, can boost the promise of long-term trading profits and take some of the stress and uncertainty out of trading.
-Establish A Goal- Having a clear idea of what you want to accomplish by trading, whether it is a short-term profit on a single trade or the desire for a long-term trading career, can go a long way toward building successful trading habits. Regardless of whether or not the goals are set on a per trade, daily or long-term basis, establishing from the outset basic levels of acceptable risk and financial reward will help curtail avoidable risk and extreme losses. Also, determine a specific time frame in which to trade: Will a position have to be liquidated by a certain time for tax purposes or for same other reason?

-Diversification- Just as in the stock market, a portfolio of different instruments can be one of the best hedges against several and unsustainable losses; a loss in one market will hopefully be offset by gains in others. Traders must take caution, though, to truly diversify their portfolios with contracts that are price independent. Spreading your trading among three or four different interest rate contracts that move in a similar fashion is not a good example of diversification, because a loss in one contract is likely to be mirrored by losses in the others. But over-diversification is dangerous, too. A trader can spread his money over too many markets, and not have enough capital in any one of them to weather even small adverse price swings.
A good rule of thumb is to stick with what you are comfortable; do not venture blindly into unknown markets just for the sake of diversification. A balance must be stuck between available resources and a manageable trading scenario. Capital constraints will, of course limit the choices traders can make, forcing those with smaller trading accounts to bypass or minimize diversification.

The Art of Contrarian Investing: Going Against the Crowd for Profit

I think with all the shorting going on, and the group that says "Ford can't possibly go much lower...I'm buying some", we all need to think about the contrarian point of view. For some of us that might be finally biting the bullet and saying "YES the economy is in trouble...I'm shorting!" Yet for others they think, "no chance the Dow continues to bomb like this, Obama will change the economy." Whatever your position, you need to understand exactly what goes into the contrarian mindset and I've asked Jon Lee from WeeklyTA.com to come and enlighten us a bit!

==============================================================

A contrarian believes that certain crowd behavior among investors can lead to exploitable mispricings in securities markets. For example, widespread pessimism about a stock can drive a price so low that it overstates the company's risks, and understates its prospects for returning to profitability. Identifying and purchasing such distressed stocks, and selling them after the company recovers, can lead to above-average gains. Conversely, widespread optimism can result in unjustifiably high valuations that will eventually lead to drops, when those high expectations don't pan out. Avoiding investments in over-hyped investments reduces the risk of such drops. – Wikipedia

Professionals vs. Non-professionals

"Whenever you find yourself on the side of the majority, it's time to pause and reflect."
– Mark Twain

What is the “Crowd”? They are the group of non-performing institutions, individual investors, traders, speculators, and other players in any market that form a collective opinion that is expressed in the terms of a degree of optimism or pessimism. We will call them the non-professionals.

The professionals are the “smart money”. These are the very few  that are aware of crowd behavior and are able to adjust their strategies (long and short) to profit from extreme sentiment. Note: professional does not mean institution by definition. Most institutions are part of the crowd.

The key point to make is that when non-professionals display an excessive amount of optimism or pessimism, the professionals enter into the market and drive prices in the opposite position. Any truly non-professional, one-sided opinion or expectation of a market will be unable to anticipate a movement created by the professionals in the opposite direction that is anticipated by the group of non-professionals. This is contrarian investing, going against the masses that believe in only one direction of a market and taking advantage of their unanimous opinion by crushing them on the other side.

Here’s a diagram I created to illustrate the above point:

How does this work? Some might argue that if everyone’s buying and extremely positive, then why would the market crash? The answer: as more and more investors buy, the market will become fully invested. The last ones buying are the ones that bought into the market when the professionals were selling and will be stuck because of this overhead limit. After everyone’s bought, there won’t be anyone left to sustain the buying. Therefore, a fearful panic ensues and the masses start to sell, most of the times much later than they should have done.

A recent example of massive cash inflow (totaling hundreds of billions of dollars) is shown below. Note that the peak of the NASDAQ was on March 10, 2000 at 5,132.52 at nearly the same time when the largest monthly in flow occurred. Clearly, everyone was invested at the full limit.

The Media’s Portrayal of “Professionals”: An Observation in Barron’s April 28th Issue

This is the “Back in the Pool” issue with the funny-looking bull cartoon testing out the pool’s temperature. Barron’s surveyed “professional” investors and here were some “crowd-like” results:

1) Describe your investment outlook through December 2008:
•    Very Bullish: 7%
•    Bullish: 43%
•    Neutral: 38%
•    Bearish: 12%
•    Very Bearish: 0%!!!

2) Is the U.S. stock market overvalued, undervalued, or fairly valued at current levels?
•    Overvalued: 10%
•    Undervalued: 55%!!!
•    Fairly valued: 35%

These questions were the biggest eye-poppers:

3) Are you beating the S&P this year professionally?
•    Yes: 74%!!!
•    No: 22%

4) Personally?
•    Yes: 72%!!!
•    No: 19%

Here's the most recent chart of the S&P 500:

The media’s definition of “professional” is not always correct so please be aware of the difference. The market is down over 40% year-to-date, so obviously the results have now changed dramatically.

Contrarian Strategies

"The fastest way to succeed is to look as if you're playing by somebody else's rules, while quietly playing by your own.” – Michael Konda

•    Buy when media headlines read the absolute worst and there is no sentiment divide among investors. Once sentiment becomes entirely pessimistic, buy. Also look out for a bottoming of new capital in flows into stocks. Historically, the good time to buy was when capital in flows were between 10 -15%.
•    Sell when everyone is overly bullish and capital in flows into common stock & mutual funds reach a high. (In 1960 the market declined 18%, in 1962 -29%, in 1966 -27%, and in 1968 -37%, while stock ownership levels were between 32- 34%, the highest ever. In 1999-2000, stock ownership levels were at 31-33%, near an all time-high)
•    Don’t fight the trend. If the primary trend is down, go short. If the primary trend is up, go long. Why fight the long-term direction of the market?
•    Watch financial networks and read newspapers and magazines to get an idea of where sentiment levels are. Magazine covers are my favorite.

Conclusion

“Follow the path of the unsafe, independent thinker. Expose your ideas to the dangers of controversy. Speak your mind and fear less the label of 'crackpot' than the stigma of conformity. And on issues that seem important to you, stand up and be counted at any cost.” – Thomas Watson

It’s safe to say that following the real professionals is the way to go. In order to do that, you have to know how they play. There are three points that I stress: 1) there is tremendous pressure and influence to join the crowd and gain easy acceptance, 2) the crowd is wrong the majority of the time, 3) under duress, psychologically, our emotions and objectivity can become distorted and cause us to rationalize (a dominant coping mechanism) or deny (a dominant defensive mechanism) even the basic realities of truth.

Investors will be able to join the crowd when appropriate, but remain flexible to leave the crowd at times when the market warns us. I encourage each investor to respect the nature of human weakness and to become a free-spirited independent thinker.

Jon Lee

WeeklyTA.com

Investing Legends Buying Up Stocks

For today's guest blog post I decided to contact Christopher Hill from Investorazzi.com. I emailed him and asked him his opinion on stocks, and what the experts are doing. Christopher has been running Investorazzi.com for quite a while now and to say I'm a fan is an understatement. Check out his blog post below and check out his site...it's worth the visit!

==================================================================

Investing Legends Buying Up Stocks

To say U.S. equities have been beaten up lately is an understatement.  As I write this post Monday evening:

* The Dow Jones Industrial Average is off almost 38 percent for 2008 (See CHART here)
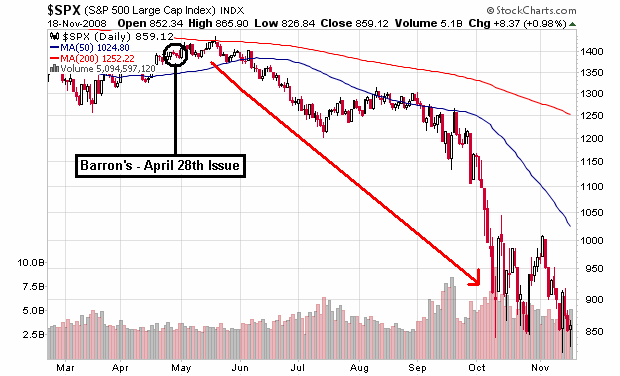
* The Standard & Poor's 500 Index is down 42 percent for the year (See CHART here)
* The Nasdaq Composite Index is now at a five-year low (See CHART here)

Turn on the news and you’d think investors couldn't get out of the stock market fast enough.  Remember that old story about someone's cousin losing their shirt from investing in commodities?  I suppose some are saying that about equities these days.

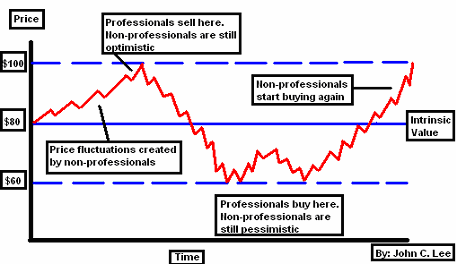
Yet, in times like these I remember a certain saying.  "Buy when there's blood in the streets."  Or, as legendary investors Jeremy Grantham and Warren Buffett might say, on the Street.  For those of you who aren't familiar with Jeremy Grantham, he is the Chairman of Boston-based GMO, a privately-held global investment firm with $152 billion under management as of the end of 2007.  The British money manager, whose clients have included U.S. Vice President Dick Cheney and former U.S. presidential candidate John Kerry, has made some terrific calls in the past quarter century:

* In 1982, said the U.S. stock market was ripe for a “major rally.” That year was the beginning of the longest bull run ever.
* In 1989, called the top of the Japanese bubble economy.
* In 1991, predicted the resurgence of U.S. large cap stocks.
* In 2000, correctly called the rallies in U.S. small cap and value stocks.
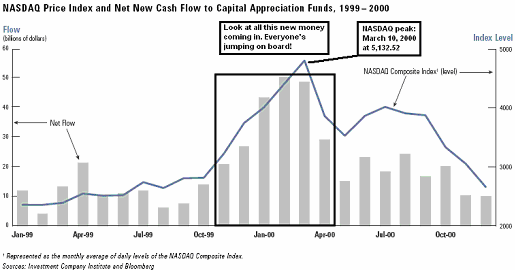
* In January 2000, warned of an impending crash in technology stocks, which took place two months later.
* In April 2007, nailing the current crisis, he wrote to shareholders, "From Indian antiquities to modern Chinese art, from land in Panama to Mayfair; from forestry, infrastructure and the junkiest bonds to mundane blue chips; it’s bubble time!"

As for Warren Buffett?  Well, who hasn't heard of the "Oracle of Omaha?"  Buffett, the richest person in the world with more than $62 billion (according to the 2008 Forbes list), amassed his multibillion dollar fortune mainly through investing in stocks and buying companies through Berkshire Hathaway, where he serves as Chairman.

These days, Grantham and Buffett both sense blood on the Street--- and are acting accordingly.  Paul J. Lim of the New York Times wrote this past Sunday:

“Mr. Grantham said in an interview that even though his firm began buying stocks in early October, after prices fell to attractive levels, the market had a tendency to “overshoot” during sell-offs… Mr. Grantham noted that GMO began buying only after its portfolios had fallen below some key thresholds. For example, in GMO’s global balanced portfolio of stocks and bonds, the firm’s minimum allocation to equities is usually 45 percent. But after the market sell-off, that equity allocation dipped to around 38 percent. So once stock prices began to look attractive, GMO started rebalancing back into what it regards as the most undervalued types of equities: emerging markets stocks and high-quality domestic blue chip shares. After a few rounds of purchases, stocks now make up around 55 percent of GMO’s global balanced portfolio.

Mr. Grantham says that although he doesn’t know how well he timed his purchases, ‘we do know that seven years out, these will be good purchases for us.’”

Even if stock prices continue to decline, Grantham told Douglas Appell of Pensions & Investments back on October 27, he still plans on buying more equities.  Appell wrote:

“Going forward, Mr. Grantham said GMO will be ‘steady buyers as the market goes down.’ The firm risks being too early, but will be in position ‘to make a ton of dough’ when the inevitable recovery comes, he said.”

Like Grantham, Buffett has also been actively acquiring shares of companies.  And like the British investor, he hasn't made a secret of his intentions.  In fact, back on October 17 he wrote in the New York Times:

“The financial world is a mess, both in the United States and abroad. Its problems, moreover, have been leaking into the general economy, and the leaks are now turning into a gusher. In the near term, unemployment will rise, business activity will falter and headlines will continue to be scary.

So … I’ve been buying American stocks. This is my personal account I’m talking about, in which I previously owned nothing but United States government bonds. (This description leaves aside my Berkshire Hathaway holdings, which are all committed to philanthropy.) If prices keep looking attractive, my non-Berkshire net worth will soon be 100 percent in United States equities.”

And what was it that triggered Buffett's latest spending spree?  The man some call “The World’s Greatest Investor” explained:

“A simple rule dictates my buying: Be fearful when others are greedy, and be greedy when others are fearful. And most certainly, fear is now widespread, gripping even seasoned investors.”

Blood on the Street, perhaps?  Morgan Housel of the financial website Motley Fool wrote Monday:

“What's the Oracle been up to lately? In the past quarter, Berkshire purchased about 24 million shares of ConocoPhillips (NYSE: COP), upping its existing stake to 84 million shares -- currently worth just less than $4 billion. As of the filing date of Sept. 30, ConocoPhillips stood as Berkshire's fourth-largest common stock holding, behind Wells Fargo (NYSE: WFC), Coca-Cola (NYSE: KO), and Procter & Gamble (NYSE: PG).

That's a pretty serious vote of confidence. Conoco shares have crashed more than 40% in the past three months, as global economies screech to a halt. In the short term, that pullback is probably justified -- energy was getting ahead of itself for a while. So did Buffett buy at the peak? Nah. For long-term investors who want to make the bold assumption that energy isn't just a passing fad, there are some serious, serious bargains being made right now.

Berkshire's other purchases in the quarter included a new 2.9 million-share investment in electrical goods manufacturer Eaton, as well as a 1.8 million-share increase in its existing stake in NRG Energy (NYSE: NRG).”

Should stock prices continue to fall, I have a feeling we’ll hear a lot more about these two investing legends--- especially regarding their latest acquisitions.

Christopher Hill

Editor Investorazzi.com

==================================================================

What's ahead for Apple (New Video)

I was looking over several charts this past weekend and I was shocked to recognize a chart formation playing out before my very eyes. I've seen this same formation a million times before, but I just didn't want to believe it could be happening to my favorite stock, Apple (NASDAQ_AAPL). Some would call this denial.

In the past I've written extensively about Apple products on this blog. If you have read any of these postings, you'd know how crazy I am about their products.

Several months ago I discovered a major technical formation that spelled trouble for Apple. I have to admit that I was saddened by this. This formation was also picked up by our "Trade Triangle" technology. Our algorithm triggered a sell signal and has continued to suggest a short position for Apple all this time.

Watch my new video on Apple.

I was surprised that we've seen this market come down so easily. It seems like every time I visit an Apple store they are always busy and their products always seem to be selling well.

The question is, are we at the end of the iPod era?

Given the chart formation, the double top and pivot point, it seems we are headed lower. The Pivot Point measures down to the $40-$50 range and Apple at $90 still has a long way to go on the downside.

What caught my eye this weekend was a weekly continuation pattern to the downside and the fact that Apple closed at a new weekly low for the year. This is not a bullish sign by any stretch of the imagination.

For this coming week, I expect to see further downside pressure on Apple. I believe that we are going to be looking at the $50-60 dollar range as our target zone. Of course everything within will be tempered by our "Trade Triangle" technology. When our short-term "Trade Triangle" turns positive, we will close out short positions and take to the sidelines. In my opinion, it's going to take some time for this market to improve and turn around. The technicals are just too weak at the moment.

Every success in trading,

Adam Hewison
President, INO.com
Co-creator, MarketClub

Put the Trader's Blog widget on your website for free. Details here.