
I invited Blain from StockTradingToGo.com back to give us his analysis on Lehman. He's missing the 4th key to selling Lehman...TRADE TRIANGLES! If you're a MarketClub member pull up Lehman in MarketClub...then take a look at where the Trade Triangles signaled you.
===============================================================
The following stock chart of Lehman Brothers (LEH) offers a great example of simple support and resistance. Support and Resistance is a basic form of technical analysis used commonly every day to mark potential buy and sell points on a stock chart.
Lehman Brothers is a good stock chart to observe for both new and seasoned investors because the recent Lehman bankruptcy offered three key sell signals for investors on the way down.
Note: This chart of Lehman Brothers is a 16 month daily stock chart:
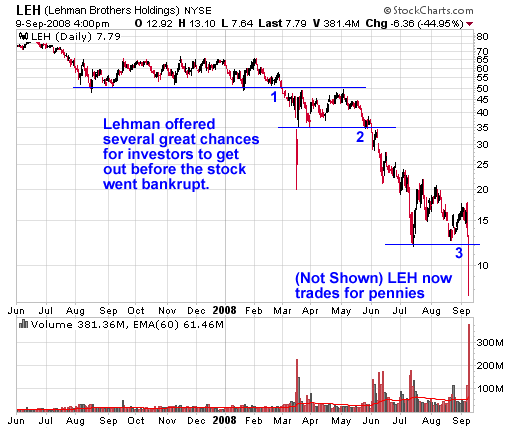
1. The blue 1 show us how at the end of February Lehman stock fell through its first key support trendline at $50. This was a big sign that the bears had control of the stock and longs should get out.
2. The blue 2 shows us where Lehman eventually collapsed below its 2nd major support trendline at $35. This was another key sign for investors to get out of the stock.
3. The blue 3 shows the tipping point for Lehman before it moved to pennies. The break below $12 a share was the last major support Lehman had, and the stock never recovered. Bankruptcy shortly followed.
View More Examples of Technical Analysis.