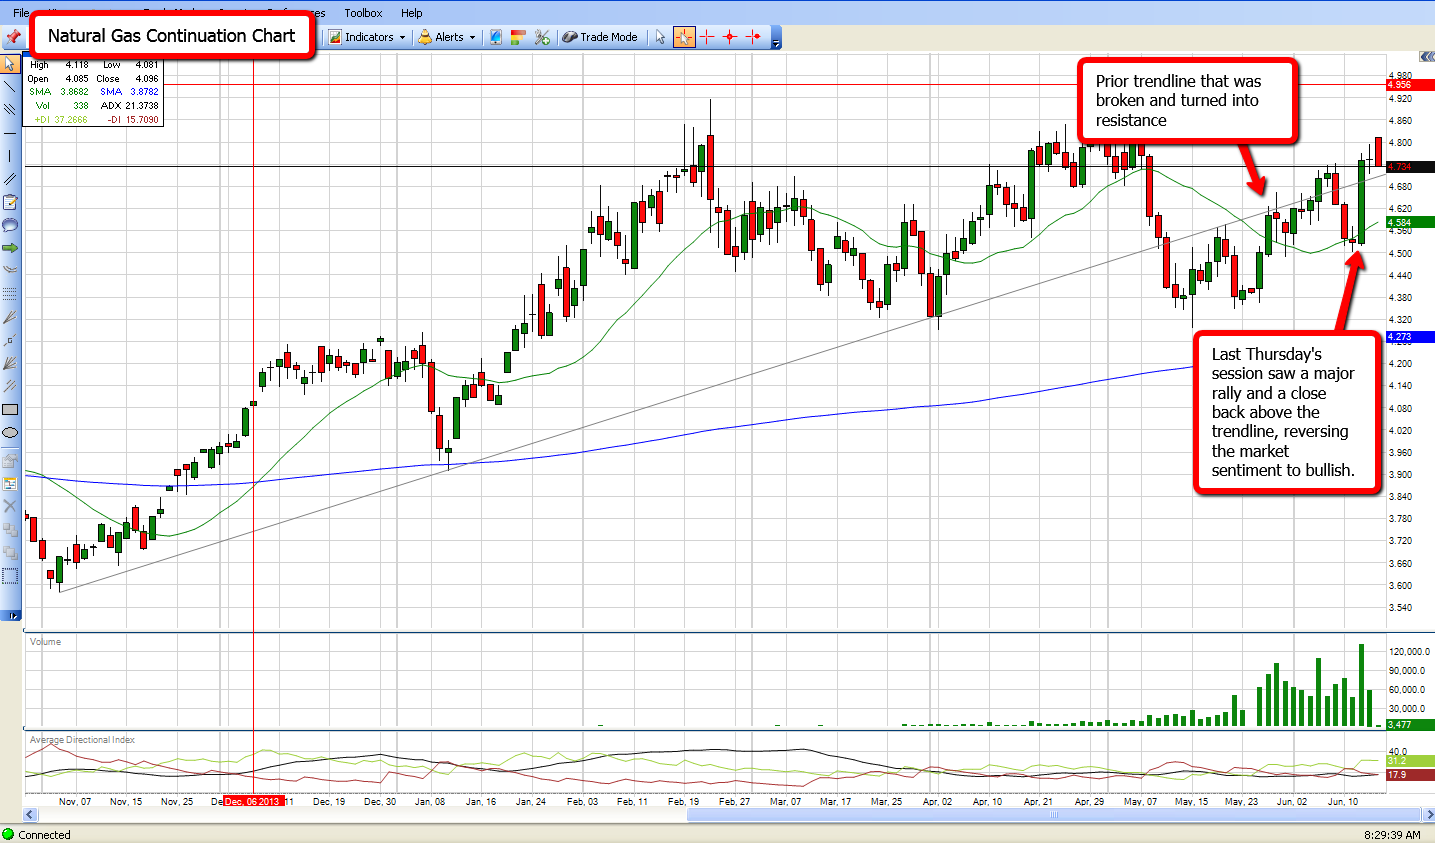
Each Week Longleaftrading.com will be providing us a chart of the week as analyzed by a member of their team. We hope that you enjoy and learn from this new feature.
To start the week, we will be watching Natural Gas futures closely. July Natural Gas saw a spike higher overnight to $4.89, but gave back those gains in the early morning hours. There is a measure of support in the market as Russia has halted Natural Gas flows to the Ukraine. Along with halted Natural Gas flows to the Uklraine, the US Natural Gas storage remains tight and sits well below the 5 year average. With a warmer weather outlook across the US, the case can be made for a bullish week in Natural Gas.
On the technical side, Natural Gas has sold off to a critical area of support at $4.70. This bullish trend-line was broken in mid-May and since become resistance in the market. After last week’s EIA inventory report on Thursday morning, the market spiked back above this trend-line with closes above it on both Thursday and Friday. In today’s session, Continue reading "Chart of The Week - Natural Gas"

