
Are the precious metals patterns predicting a big downside price event?
Our trading team witnessed a big drop in Platinum and Palladium prices early this morning while Gold and Silver continued to push moderately higher. We began to question this move and investigate any historical relevance to previous patterns. Our research team pointed out that both Platinum and Palladium rolled lower just 3 to 4 days before the breakdown in the US stock markets on February 24, 2020, while Gold and Silver were reaching recent price peaks. Could the patterns in precious metals be a warning of another potential volatility spike and price decline in the near future?
Our research team created the charts below to help highlight the pattern that we are seeing in Precious Metals right now. First, we highlighted February 24, 2020, with a light blue vertical line to more clearly illustrate where the markets initiated the COVID-19 breakdown event. Next, we drew shaded rectangles around new downside price rotation levels that took place near this peak in the US stock markets. Lastly, we drew a red line that highlights the subsequent price decline that took place in Precious Metals as the markets tanked in late February and early March 2020.
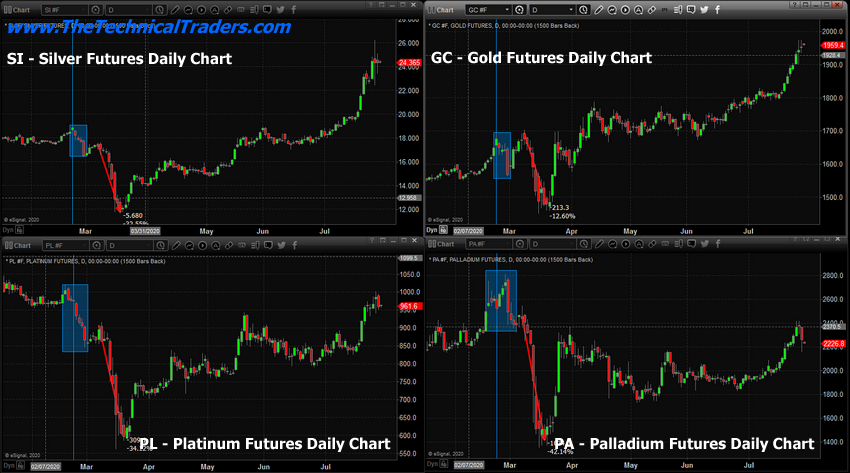
The current downside price move in Platinum and Palladium are very interesting because it appears Platinum and Palladium both initiated a downside/contraction price event just 3 to 4 days before Gold and Silver, as well as the rest of the US stock market, began to collapse on February 25, 2020. You can clearly see in the bottom two charts that Platinum and Palladium initiated a downside price correction a few days before both Gold and Silver reached their peak levels and began to move lower. Once this peak rotation took place, all four of the major metals groups moved moderately lower for about 7 days before pausing, then collapsed even further. Continue reading "Precious Metals Warn Of Increased Volatility"