Platinum Outshines Palladium, Yet Both Offer Opportunity

Almost four years ago, I wrote about the supremacy of palladium over platinum, and we watched the Platinum/Palladium ratio fall below its long-term valley of 0.56 oz.

In contrast, today the Platinum/Palladium ratio is approaching a 4-year high of 0.7 oz, marking a doubling from its all-time low of 0.31 oz established in 2020.

Platinum-Palladium Ratio Monthly

Source: TradingView

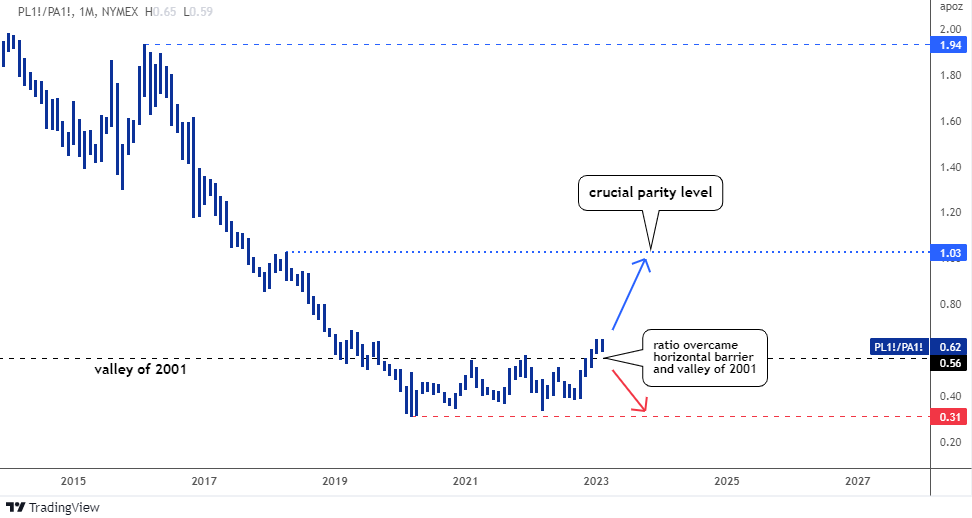
On its way up, the ratio broke through a double barrier that included the 2001 valley of 0.56 oz and the horizontal resistance at the top of the range. There are no other barriers for the ratio until it reaches parity between the two metals, which will be a crucial resistance level.

This is because palladium was replaced with the cheaper platinum in the automobile industry due to palladium's abnormally expensive price.

It is estimated that the platinum substitution of palladium reached 340 koz in 2022, and it is predicted to increase to over 500 koz in 2023, more than twice the amount in 2021. Continue reading "Platinum Outshines Palladium, Yet Both Offer Opportunity"

Platinum And Palladium Update

I put the platinum first as it has a clearer structure. The big map has remained unchanged since 2019; I put it down below to brush up.

Platinum

We are in leg 2 (black) with a completed AB part (next chart). I expected the CD part to start earlier. However, the bullish trigger was left untouched and the market collapsed further down.

Platinum

The third red leg down has hammered the platinum futures price below $1,000 handle to hit the valley in $893. It is amazing how symmetry works here, as all three legs are almost equal to each other. It is a good sign for the platinum as it suffered a lot. Continue reading "Platinum And Palladium Update"

Platinum And Silver Update

One of our regular readers kindly requested the update of Platinum chart. Here we go as promised.

The global outlook for platinum posted in 2019 remains unchanged and you could see that big chart at this link. The previous update was this February as I used the cloning technique to visualize the current second leg up. Platinum futures prices did not follow it, therefore, below is the updated chart.

Weekly Platinum Chart

The leg 2 up had started with a two-leg zigzag up labeled as a blue AB part. It looks symmetric as both legs are almost equal and have the same trajectory. Then we can clearly distinguish the BC consolidation part, which consists of two legs down (red zigzag). It pierced the 38.2% Fibonacci retracement level to hit the valley of $1022. The RSI dropped slightly below the crucial 50 level. Continue reading "Platinum And Silver Update"

Palladium Futures To $4,628?

Last summer I spotted a hot trading opportunity for you with 45% potential gain as Palladium futures were set to retest the all-time high. The progress was not as nimble as I thought; however, the target was reached this April as the price even overlapped it. Most of you supported that option, and I hope you enjoyed that gain.

Weekly palladium Chart

It looks like this champion metal offers another stunning opportunity for traders.

The crawling move to the upside since 2016 with a rocket style ending in 2019-2020 was marked as AB part. Continue reading "Palladium Futures To $4,628?"

Is Platinum A Runaway Train?

It looks like my post titled "Platinum Could Rocket To $1912" published in November 2019 could turn prophetic as the price of platinum price is moving quickly in the direction of the called target. The majority of readers supported this idea at that time, although with a small margin.

Below is that very chart where I shared the global structure for the large complex correction in the platinum market.

Platinum
Chart courtesy of stooq.com

To remind you, the idea was that leg 2 to the upside (black up arrow) should complete the "joint" between large red legs to the downside. It was thought to retest the top of leg 1 above $1900. The price was at $890 then. Continue reading "Is Platinum A Runaway Train?"