The guy sitting next to you at work making all that money trading currency does not have a special Forex crystal ball. What he is doing to ensure continued profits in his trades is reading indicators and then basing his currency trading moves on them. Once you adopt this practice, how to increase your Forex trading account will no longer seem like such a mystery.
What are Indicators?
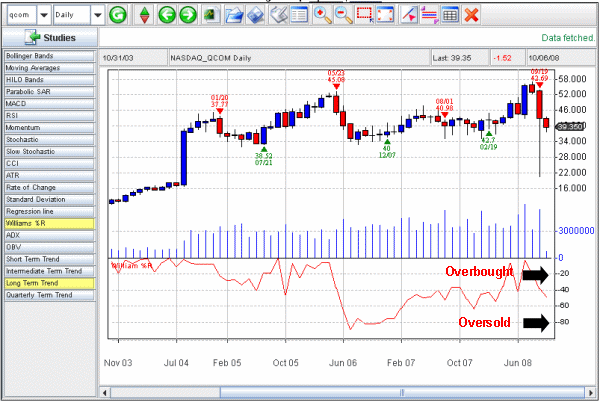
Trading currency requires knowing when to buy and when to sell and the sooner the better. This requires studying charts to see how the pair you are trading moves under current circumstances. These movements are known as indicators, and once you master them you will become that same Forex fortune teller as the guy in the next cubicle.
Identifying the Type of Market
When looking at a chart, the first thing you are going to want to pick out is the type of market you are dealing with. This will help you in determining the type of indicator you are going to use. A trending market is when the price of the currency is moving steadily, either higher or lower. These can be seen by long lines heading in one direction. Ranging markets are noted by strong resistance and support levels, where even with sharp fluctuations the currency is not breaking through.
Moving Averages
Continue reading "Growing Profits in Forex Trading By Using Indicators"