BTC Technical Outlook Is Bullish!

If you've hung around my articles long enough, you know that when I take a look at what assets to devote my hard-earned cash to, I've found that both technical and fundamental analysis are two great tools. They've served me well over the years.

In fact, earlier this year I did a deep dive into why both technical and fundamental analysis is the dynamic duo of investing. And I didn't pull any punches about the merits of using both these tools. Here's what I said:

Through my experience as a stockbroker, accountant, and financial analyst, I can tell you that the best investors I've run across usually deploy a mixture of fundamental and technical analysis when they go around looking for investments. They want to know what an asset does and how it makes money. But they also want to know what's happening to its price.

Today, I'm going to revisit the first of these tools, technical analysis, and apply two of my favorite tools in that toolbox to Bitcoin (BTC). Why? Because when I fired up my computers and screeners this morning, my technical signals were going off the charts.

So, let's get to it! Continue reading "BTC Technical Outlook Is Bullish!"

U.S. 10-Year Yield: It's Not "If" But "When"

Life is full of surprises as we never know what could happen next, and it is the true phenomenon of our existence. Last time I shared my thoughts about the U.S. 10-year yield (10Y) in September of 2018 calling for a rise to 3.33% and more. JPMorgan Chase CEO Jamie Dimon warned that time to be prepared for a 5% 10-year yield. Let’s take a look a what you thought then.

10-Year Yield

Most of you agreed with JPM’s CEO and hit the 5% option. The atmosphere then was so elevated that it was easy to believe that the rates would keep rising. Indeed, the market went higher but stopped at the 3.26% mark, and that was it. The least favored target of 3.33% appeared to be the closest call.

The precious metals’ posts schedule was busy here on the blog at the end of last year, so I posted my call at tradingview.com for 10-year yield to drop to tag the previous low of 1.34% on November 14th of 2019. Below is the chart of that post. Continue reading "U.S. 10-Year Yield: It's Not "If" But "When""

S&P 500: Drag & Drop?

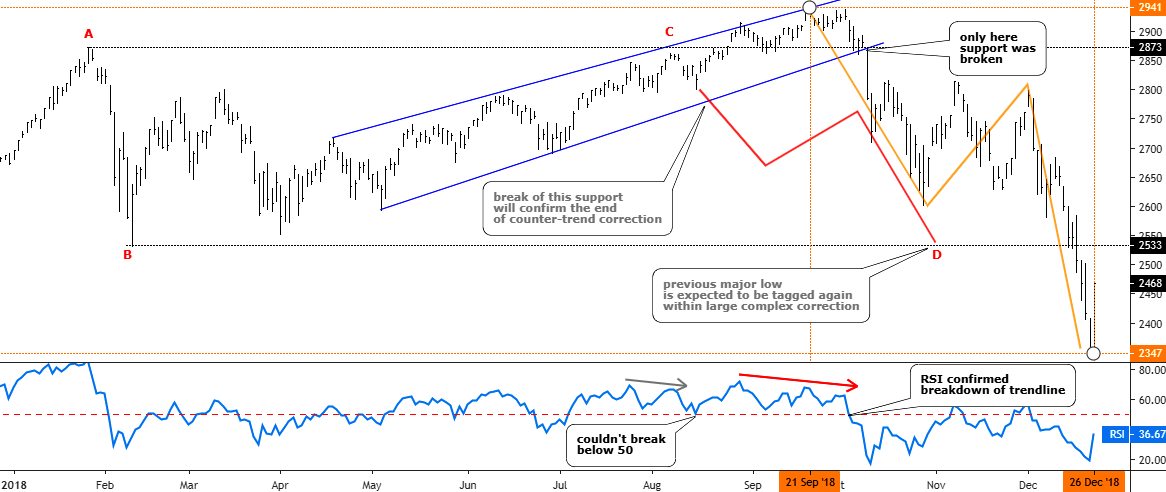
Last August I was thinking of the S&P 500 index and wondered if its uptrend had been exhausted on its way to the upside. The price was at the $2833 level, and it failed to break the earlier top of $2873. The RSI showed the Bearish divergence and the index started to drift lower. I thought it was a complex correction and another drop to hit the lower bound of the $2533-$2873 range was considered to be imminent. The majority of you supported this idea.

Let’s check the updated chart below to see what happened next.

Updated S&P Daily chart tailored in August 2018.

LLLL
Chart courtesy of tradingview.com

As we can see from the chart above the idea itself was good as the price not only retested but just smashed the so-called “bottom” of the range. The actual CD segment, which initially was thought to be equal to AB segment, had reached the ratio of 1.75 exceeding the next most common after 1:1 ratio of 1.618 (Fibonacci ratio) amid the panic sell-off. The trigger, which was set on the downside of the blue uptrend, was right as the index didn’t look back until the very bottom after it fell out of that blue uptrend. That move was accurately confirmed with a breakdown of the 50 level on the RSI sub-chart. The predicted zigzag structure of the drop also appeared to be correct as it is natural market behavior when one market stage changes the other. And talking about where we were right, I also would like to show you the ballot results on the timing of the bottom of the drop. Continue reading "S&P 500: Drag & Drop?"

Gold Extends Consolidation Giving Silver Another Chance

Gold and silver exchange leading roles in the market quite often, especially on the short-term charts. Last time I wrote about it silver saved gold from collapse at the start of this month. The white metal unexpectedly bounced off the earlier low reversing the drop of the yellow metal.

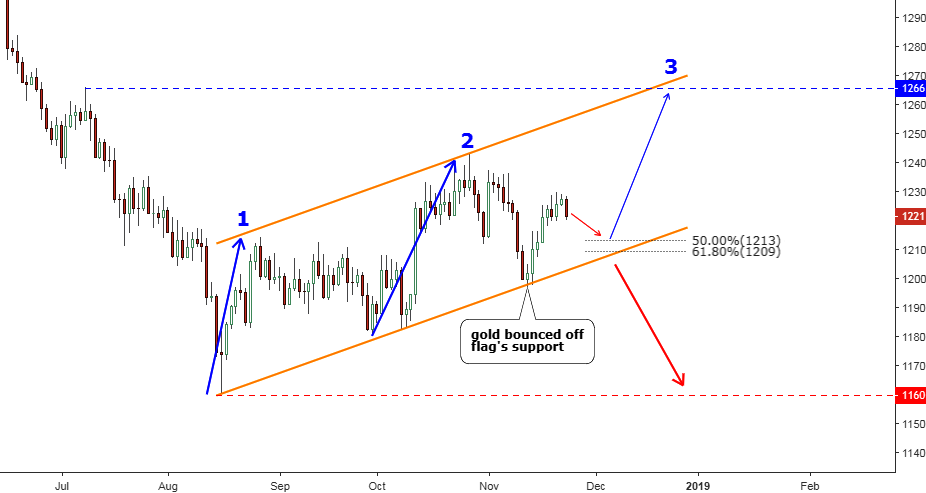
This time gold took the lead as its failure to break below the Bear Flag let silver lick its wounds and return above the $14 handle.

Both metals are still trapped in the middle of the range set by the earlier heavy drop, which first occurred in gold and then it was repeated in the silver market. In this post, I have focused on the local structure as the bigger picture remains unchanged.

Chart 1. Gold Daily: 3rd Leg Up Is Uncommon But Possible

consolidation
Chart courtesy of tradingview.com

The top metal couldn’t break below the trendline support of a Bear Flag (orange) and then quickly restored most of its losses coming back above $1200. It is interesting that the forecasted drop unfolded quite differently in each metal. Silver tagged the earlier trough, but gold failed even to breach the vertically sloped trendline. It looks like strong demand appeared right at the round number of the gold price in the $1200 area. Continue reading "Gold Extends Consolidation Giving Silver Another Chance"

Gold & Silver: Falling Knives

Silver has failed to complete the second leg up as it couldn’t break above the August top of $15. It is interesting that this misbehavior of the white metal didn’t surprise you as the majority of you had bet last week that silver would fail and drop below $14.2. It’s impressive how accurate your forecast was!

In this post, I would like to update downside targets as we should be prepared for the resumption of the drop in metals after pullbacks have been finished.

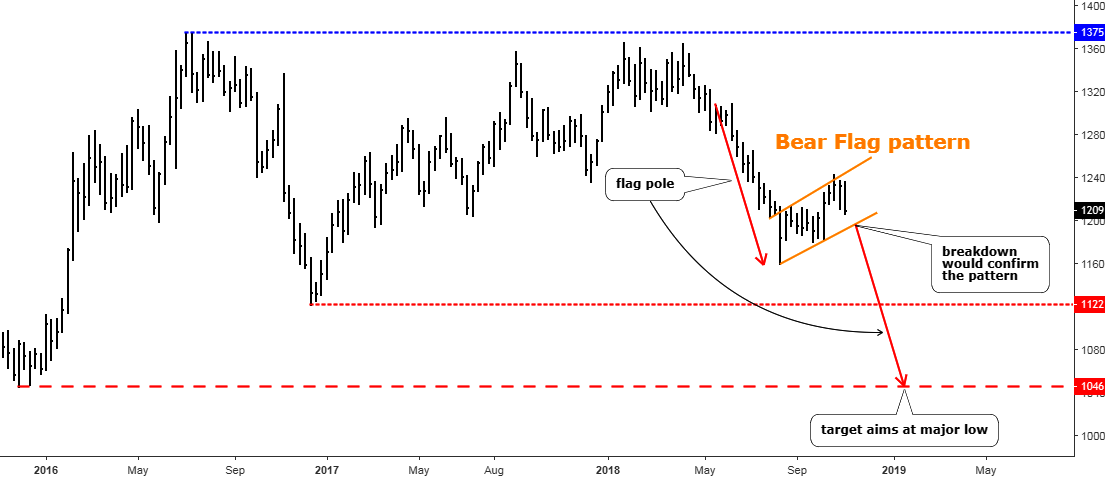
Chart 1. Gold Weekly: Bear Flag Targets Bottom

falling knives
Chart courtesy of tradingview.com

Last week I reminded you of the big range of trade, which requires the retest of the downside of the range to complete the setup. Continue reading "Gold & Silver: Falling Knives"