
We hope you enjoyed the brief holiday break… it seems Bitcoin has been busy while the markets have been resting! Bitcoin enthusiasts are adamant that the price rally has just started a parabolic move higher. From a technical standpoint, this current rally certainly appears to have gone parabolic. As any trader already understands, what goes up may eventually come crashing downward.
My research team and I believe failure at the current highs would represent a clear technical divergence pattern between price and the RSI indicator. Additionally, the current rally that started on December 20 consists of a $10,850 rally phase. The previous rally from October 20 to December 2 consisted of a $9,200 rally phase. We believe this current rally phase from December 11 could be a Wave 5 rally (almost equal to the Wave 3 rally range). If our researchers are correct, this final rally phase could come crashing downward after reaching these peak levels above $28,000.
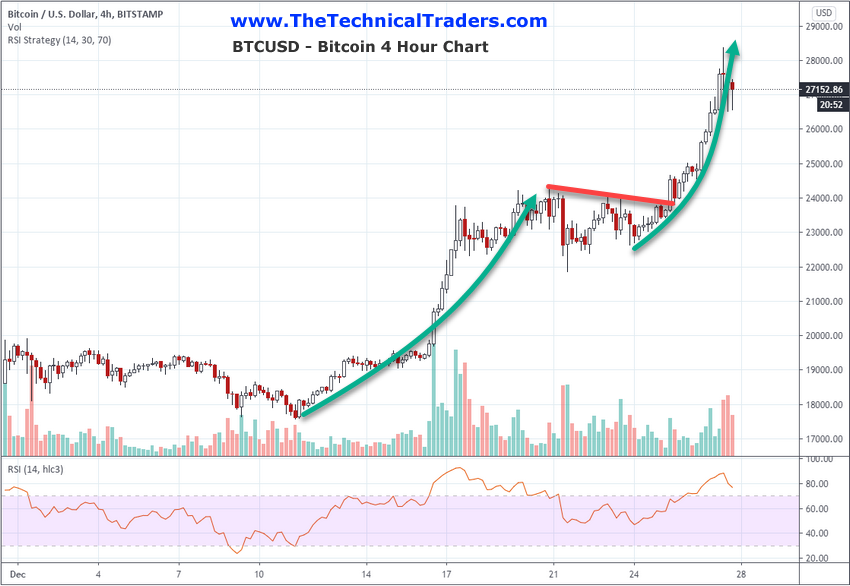
This 4 Hour Bitcoin chart highlights the incredible price rally that has taken place over the past 16+ days – a rally of over $10,000. It also highlights two very clear price rally phases – creating an A-B-C price wave pattern.
This Daily Bitcoin chart highlights the two, almost identical in size, which has created a price peak above $28,000. It also highlights the technical divergence between price and the RSI indicator in the lower pane. Continue reading "Has Bitcoin Reached Its Peak?"